什么是Prometheus?

Prometheus是由SoundCloud开发的开源监控报警系统和时序列数据库(TSDB)。Prometheus使用Go语言开发,是Google BorgMon监控系统的开源版本。
2016年由Google发起Linux基金会旗下的原生云基金会(Cloud Native Computing Foundation), 将Prometheus纳入其下第二大开源项目。
Prometheus目前在开源社区相当活跃。
Prometheus和Heapster(Heapster是K8S的一个子项目,用于获取集群的性能数据。)相比功能更完善、更全面。Prometheus性能也足够支撑上万台规模的集群。

Prometheus的特点

  • 多维度数据模型。
  • 灵活的查询语言。
  • 不依赖分布式存储,单个服务器节点是自主的。
  • 通过基于HTTP的pull方式采集时序数据。
  • 可以通过中间网关进行时序列数据推送。
  • 通过服务发现或者静态配置来发现目标服务对象。
  • 支持多种多样的图表和界面展示,比如Grafana等。

官网地址:https://prometheus.io/

架构图

基本原理

Prometheus的基本原理是通过HTTP协议周期性抓取被监控组件的状态,任意组件只要提供对应的HTTP接口就可以接入监控。不需要任何SDK或者其他的集成过程。这样做非常适合做虚拟化环境监控系统,比如VM、Docker、Kubernetes等。输出被监控组件信息的HTTP接口被叫做exporter 。目前互联网公司常用的组件大部分都有exporter可以直接使用,比如Varnish、Haproxy、Nginx、MySQL、Linux系统信息(包括磁盘、内存、CPU、网络等等)。

服务过程

  • Prometheus Daemon负责定时去目标上抓取metrics(指标)数据,每个抓取目标需要暴露一个http服务的接口给它定时抓取。Prometheus支持通过配置文件、文本文件、Zookeeper、Consul、DNS SRV Lookup等方式指定抓取目标。Prometheus采用PULL的方式进行监控,即服务器可以直接通过目标PULL数据或者间接地通过中间网关来Push数据。
  • Prometheus在本地存储抓取的所有数据,并通过一定规则进行清理和整理数据,并把得到的结果存储到新的时间序列中。
  • Prometheus通过PromQL和其他API可视化地展示收集的数据。Prometheus支持很多方式的图表可视化,例如Grafana、自带的Promdash以及自身提供的模版引擎等等。Prometheus还提供HTTP API的查询方式,自定义所需要的输出。
  • PushGateway支持Client主动推送metrics到PushGateway,而Prometheus只是定时去Gateway上抓取数据。
  • Alertmanager是独立于Prometheus的一个组件,可以支持Prometheus的查询语句,提供十分灵活的报警方式。

三大套件

  • Server 主要负责数据采集和存储,提供PromQL查询语言的支持。
  • Alertmanager 警告管理器,用来进行报警。
  • Push Gateway 支持临时性Job主动推送指标的中间网关。

安装

Prometheus
1
curl -LO https://github.com/prometheus/prometheus/releases/download/v2.23.0/prometheus-2.23.0.linux-amd64.tar.gz

解压安装

1
2
3
4
5
6
7
8
9
10
11
12
13
14
tar zxvf prometheus-2.23.0.linux-amd64.tar.gz
mv prometheus-2.23.0.linux-amd64 /opt/
vi /usr/lib/systemd/system/prometheus.service
[Unit]
Description=Prometheus Monitoring System
Documentation=Prometheus Monitoring System

[Service]
ExecStart=/opt/prometheus-2.23.0.linux-amd64/prometheus \
--config.file=/opt/prometheus-2.23.0.linux-amd64/prometheus.yml \
--web.listen-address=:9090

[Install]
WantedBy=multi-user.target

启动

1
2
systemctl start prometheus
systemctl enable prometheus

配置文件详解

1
2
3
4
5
6
7
8
9
10
11
12
13
14
15
16
17
18
19
20
21
22
23
24
25
26
27
# my global config
global:
scrape_interval: 15s # Set the scrape interval to every 15 seconds. Default is every 1 minute.
evaluation_interval: 15s # Evaluate rules every 15 seconds. The default is every 1 minute.
# scrape_timeout is set to the global default (10s).

# Alertmanager configuration
alerting:
alertmanagers:
- static_configs:
- targets:
# - alertmanager:9093

# Load rules once and periodically evaluate them according to the global 'evaluation_interval'.
rule_files:
# - "first_rules.yml"
# - "second_rules.yml"

# A scrape configuration containing exactly one endpoint to scrape:
# Here it's Prometheus itself.
scrape_configs:
# The job name is added as a label `job=<job_name>` to any timeseries scraped from this config.
- job_name: 'prometheus'
# metrics_path defaults to '/metrics'
# scheme defaults to 'http'.
static_configs:
- targets: ['localhost:9090']
  • global: 此片段指定的是prometheus的全局配置, 比如采集间隔,抓取超时时间等。
  • scrape_interval: 抓取间隔,默认继承global值。
  • scrape_timeout: 抓取超时时间,默认继承global值。
  • rule_files: 此片段指定报警规则文件, prometheus根据这些规则信息,会推送报警信息到alertmanager中。
  • scrape_configs: 此片段指定抓取配置,prometheus的数据采集通过此片段配置。
  • alerting: 此片段指定报警配置, 这里主要是指定prometheus将报警规则推送到指定的alertmanager实例地址。
  • metric_path: 抓取路径, 默认是/metrics
  • scheme: 指定采集使用的协议,http或者https。
  • params: 指定url参数。
  • basic_auth: 指定认证信息。
  • *_sd_configs: 指定服务发现配置
  • static_configs: 静态指定服务job。
  • relabel_config: relabel设置。

static_config示例

1
2
3
4
5
6
7
scrape_configs:
- job_name: 'prometheus'
static_configs:
- targets: ['localhost:9090']
- job_name: "node"
static_configs:
- targets: ['192.168.50.57:9100','192.168.50.58:9100','192.168.50.59:9100']

file_sd_configs示例

1
2
3
4
5
6
7
8
9
10
11
12
13
14
15
16
17
18
19
20
21
22
23
24
25
26
27
28
29
30
31
32
scrape_configs:
# The job name is added as a label `job=<job_name>` to any timeseries scraped from this config.
- job_name: 'prometheus'

# metrics_path defaults to '/metrics'
# scheme defaults to 'http'.

static_configs:
- targets: ['localhost:9090']
- job_name: "node"
file_sd_configs:
- refresh_interval: 1m
files:
- "/usr/local/prometheus/prometheus/conf/node*.yml"

# 独立文件配置如下
cat conf/node-dis.conf
- targets: ['192.168.50.57:9100','192.168.50.58:9100','192.168.50.59:9100']
或者可以这样配置
[root@node00 conf]# cat node-dis.yml
- targets:
- "192.168.100.10:20001"
labels:
hostname: node00
- targets:
- "192.168.100.11:20001"
labels:
hostname: node01
- targets:
- "192.168.100.12:20001"
labels:
hostname: node02

通过file_fd_files 配置后我们可以在不重启prometheus的前提下, 修改对应的采集文件(node_dis.yml), 在特定的时间内(refresh_interval),prometheus会完成配置信息的载入工作。

relabel_config示例

新标记是一个功能强大的工具,可以在目标的标签集被抓取之前重写它,每个采集配置可以配置多个重写标签设置,并按照配置的顺序来应用于每个目标的标签集。

目标重新标签之后,以__开头的标签将从标签集中删除的。

relabel的action类型

  • replace: 对标签和标签值进行替换。
  • keep: 满足特定条件的实例进行采集,其他的不采集。
  • drop: 满足特定条件的实例不采集,其他的采集。
  • labeldrop: 对抓取的实例特定标签进行删除。
  • labelkeep: 对抓取的实例特定标签进行保留,其他标签删除。
replace

原配置

1
2
3
4
5
6
7
8
9
10
11
12
13
14
15
16
17
18
19
20
21
22
23
24
25
26
27
28
29
30
31
32
33
34
35
global:
scrape_interval: 5s # Set the scrape interval to every 15 seconds. Default is every 1 minute.
evaluation_interval: 5s # Evaluate rules every 15 seconds. The default is every 1 minute.

alerting:
alertmanagers:
- static_configs:
- targets:
- localhost:9093

rule_files:
- "/opt/prometheus-2.23.0.linux-amd64/rule.yml"

scrape_configs:
- job_name: 'prometheus'
static_configs:
- targets: ['localhost:9090']


- job_name: 'node'
file_sd_configs:
- refresh_interval: 1m
files:
- "/opt/prometheus-2.23.0.linux-amd64/conf/node*.yml"
vi conf/node-dis.yml
- targets: ['192.168.50.57:9100']
labels:
__hostname__: dev-database
__region_id__: "cn-beijing"
__availability_zone__: "a"
- targets: ['localhost:9100']
labels:
__hostname__: prometheus
__region_id__: "cn-beijing"
__availability_zone__: "b"

此时查看target信息,如下图。

设置relabel,将labels中的__hostname__替换为node_name

1
2
3
4
5
6
7
8
9
10
11
12
13
14
15
16
17
18
19
20
21
22
23
24
25
26
27
28
global:
scrape_interval: 5s # Set the scrape interval to every 15 seconds. Default is every 1 minute.
evaluation_interval: 5s # Evaluate rules every 15 seconds. The default is every 1 minute.

alerting:
alertmanagers:
- static_configs:
- targets:
- localhost:9093

rule_files:
- "/opt/prometheus-2.23.0.linux-amd64/rule.yml"

scrape_configs:
- job_name: 'bounter-monitor'
scrape_interval: 5s
metrics_path: '/actuator/prometheus'
static_configs:
- targets: ['192.168.10.228:8080']
labels:
__hostname__: springboot
relabel_configs:
- source_labels:
- "__hostname__"
regex: "(.*)"
target_label: "nodename"
action: replace
replacement: "$1"

重启服务查看target信息如下图:

source_labels指定我们我们需要处理的源标签, target_labels指定了我们要replace后的标签名字, action指定relabel动作,这里使用replace替换动作。 regex去匹配源标签(hostname)的值,”(.*)”代表hostname这个标签是什么值都匹配的,然后replacement指定的替换后的标签(target_label)对应的数值。采用正则引用方式获取的。

修改 ‘’regex: “(dev-database)”‘的时候可以看到如下图。

我们的基础信息里面有__region_id____availability_zone__但是我想融合2个字段在一起,可以通过replace来实现。

修改配置如下:

1
2
3
4
5
6
7
8
9
10
11
12
13
14
15
16
17
18
19
20
21
22
23
24
25
26
27
28
global:
scrape_interval: 5s # Set the scrape interval to every 15 seconds. Default is every 1 minute.
evaluation_interval: 5s # Evaluate rules every 15 seconds. The default is every 1 minute.

alerting:
alertmanagers:
- static_configs:
- targets:
- localhost:9093

rule_files:
- "/opt/prometheus-2.23.0.linux-amd64/rule.yml"

scrape_configs:
- job_name: 'node'
file_sd_configs:
- refresh_interval: 1m
files:
- "/opt/prometheus-2.23.0.linux-amd64/conf/node*.yml"
relabel_configs:
- source_labels:
- "__region_id__"
- "__availability_zone__"
separator: "-"
regex: "(.*)"
target_label: "region_zone"
action: replace
replacement: "$1"

target如下图:

keep

原配置

1
2
3
4
5
6
7
8
9
10
11
12
13
14
15
16
17
18
19
20
21
22
23
24
global:
scrape_interval: 5s # Set the scrape interval to every 15 seconds. Default is every 1 minute.
evaluation_interval: 5s # Evaluate rules every 15 seconds. The default is every 1 minute.

alerting:
alertmanagers:
- static_configs:
- targets:
- localhost:9093

rule_files:
- "/opt/prometheus-2.23.0.linux-amd64/rule.yml"

scrape_configs:
- job_name: 'prometheus'
static_configs:
- targets: ['localhost:9090']


- job_name: 'node'
file_sd_configs:
- refresh_interval: 1m
files:
- "/opt/prometheus-2.23.0.linux-amd64/conf/node*.yml"

target信息如下图:

修改配置文件

1
2
3
4
5
6
7
8
9
10
11
12
13
14
15
16
17
18
19
20
21
22
23
24
25
26
global:
scrape_interval: 5s # Set the scrape interval to every 15 seconds. Default is every 1 minute.
evaluation_interval: 5s # Evaluate rules every 15 seconds. The default is every 1 minute.

alerting:
alertmanagers:
- static_configs:
- targets:
- localhost:9093

rule_files:
- "/opt/prometheus-2.23.0.linux-amd64/rule.yml"

scrape_configs:
- job_name: 'bounter-monitor'
scrape_interval: 5s
metrics_path: '/actuator/prometheus'
static_configs:
- targets: ['192.168.10.228:8080']
labels:
__hostname__: springboot
relabel_configs:
- source_labels:
- "__hostname__"
regex: "(dev-database)"
action: keep

target如下图:

action为keep,只要source_labels的值匹配regex:(dev-database)的实例才能会被采集。 其他的实例不会被采集。

drop

更改action为drop,target如下图:

action为drop,只要source_labels的值匹配regex(dev-database)的实例不会被采集。 其他的实例会被采集。

labelkeep
NodeExporter
1
curl -LO https://github.com/prometheus/node_exporter/releases/download/v1.0.1/node_exporter-1.0.1.linux-amd64.tar.gz

解压安装

1
2
3
4
5
6
7
8
9
10
11
12
13
tar zxvf node_exporter-1.0.1.linux-amd64.tar.gz
mkdir -p /export/prometheus_exporter
mv node_exporter-1.0.1.linux-amd64/ /export/prometheus_exporter/node_exporter
vi /usr/lib/systemd/system/node_exporter.service
[Unit]
Description=node_exporter
After=network.target

[Service]
ExecStart=/export/prometheus_exporter/node_exporter/node_exporter

[Install]
WantedBy=multi-user.target

启动

1
2
systemctl start node_exporter
systemctl enable node_exporter
alertmanager
1
2
https://github.com/prometheus/alertmanager/releases/download/v0.21.0/alertmanager-0.21.0.linux-amd64.tar.gz
mv alertmanager-0.15.2.linux-amd64/ alertmanager

创建启动文件

1
vi /usr/lib/systemd/system/alertmanager.service

添加如下内容:

1
2
3
4
5
6
7
8
9
10
[Unit]
Description=alertmanager
Documentation=https://github.com/prometheus/alertmanager
After=network.target
[Service]
Type=simple
ExecStart=/usr/local/alertmanager/alertmanager --config.file=/usr/local/alertmanager/alert-test.yml
Restart=on-failure
[Install]
WantedBy=multi-user.target

Alertmanager 安装目录下默认有 alertmanager.yml 配置文件,可以创建新的配置文件,在启动时指定即可。

1
2
3
4
5
6
7
8
9
10
11
12
13
14
15
16
17
18
19
20
global:
smtp_smarthost: 'smtp.qq.com:465'
smtp_from: '2977358239@qq.com'
smtp_auth_username: '2977358239@qq.com'
smtp_auth_password: 'jgigqzrlhycddhcf' # 这里是邮箱的授权密码,不是登录密码
smtp_require_tls: false
templates:
- '/alertmanager/template/*.tmpl'
route:
group_by: ['alertname', 'cluster', 'service']
group_wait: 30s
group_interval: 5m
repeat_interval: 10m
receiver: default-receiver
receivers:
- name: 'default-receiver'
email_configs:
- to: 'nimingkun@dingtalk.com'
html: ''
headers: { Subject: "[WARN] 报警邮件 test" }

smtp_smarthost:是用于发送邮件的邮箱的 SMTP 服务器地址+端口;

smtp_auth_password:是发送邮箱的授权码而不是登录密码;

smtp_require_tls:不设置的话默认为 true,当为 true 时会有 starttls 错误,为了简单这里设置为 false;

templates:指出邮件的模板路径;

receivers 下 html 指出邮件内容模板名,这里模板名为 “alert.html”,在模板路径中的某个文件中定义。

headers:为邮件标题;

3,配置告警规则

配置 rule.yml

1
2
3
4
5
6
7
8
9
10
11
12
13
cd /usr/local/prometheus
vim rule.yml
groups:
- name: alert-rules.yml
rules:
- alert: dev-database # alert 名字
expr: up{job="dev-database"} == 0 # 判断条件
for: 10s # 条件保持 10s 才会发出 alter
labels: # 设置 alert 的标签
severity: "critical"
annotations: # alert 的其他标签,但不用于标识 alert
description: 服务器 已当机超过 20s
summary: 服务器 运行状态

在 prometheus.yml 中指定 rule.yml 的路径

1
2
3
4
5
6
7
8
9
10
11
12
13
14
15
16
17
18
19
20
21
22
23
24
25
26
27
28
29
30
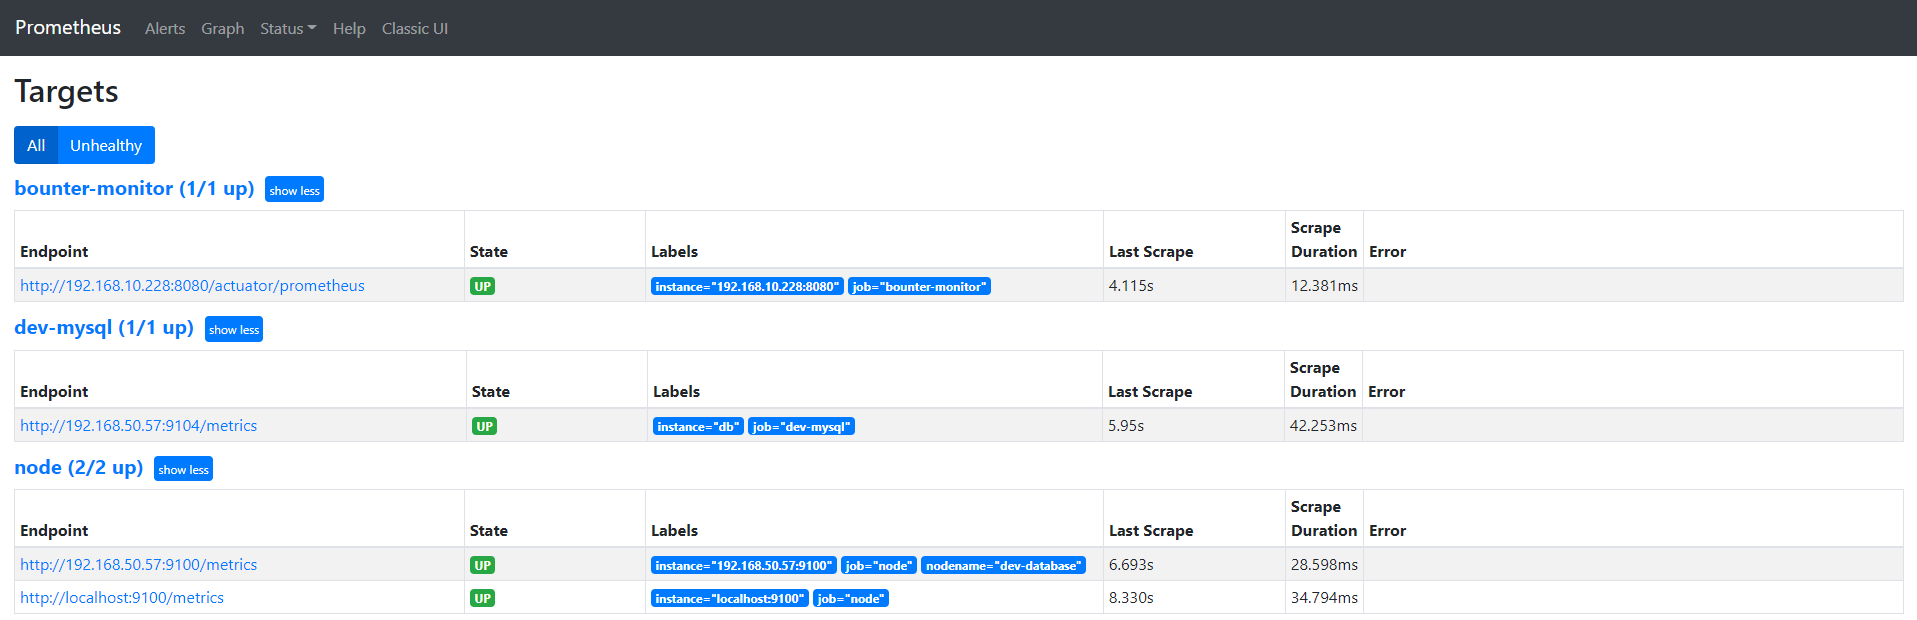
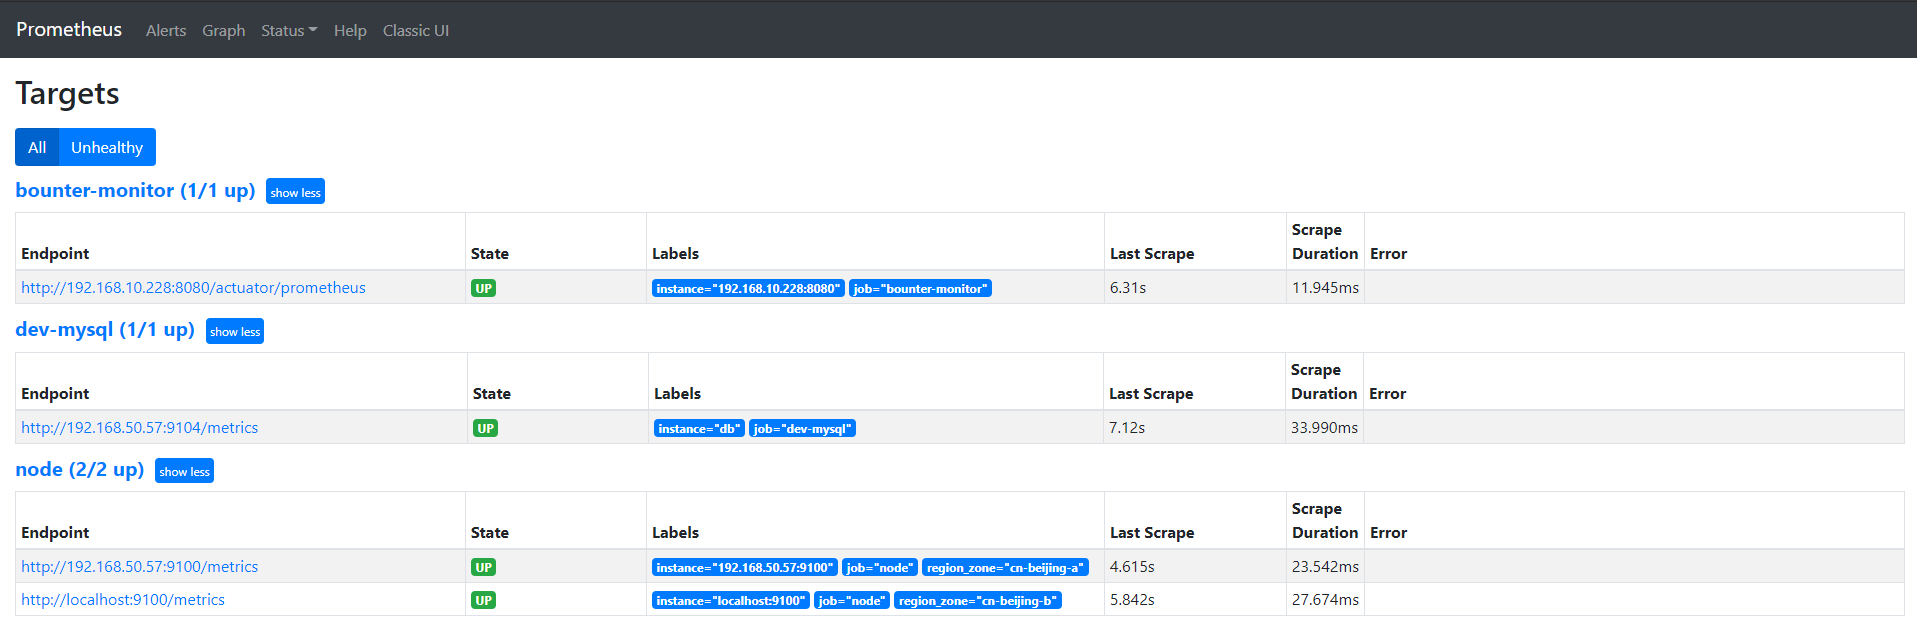
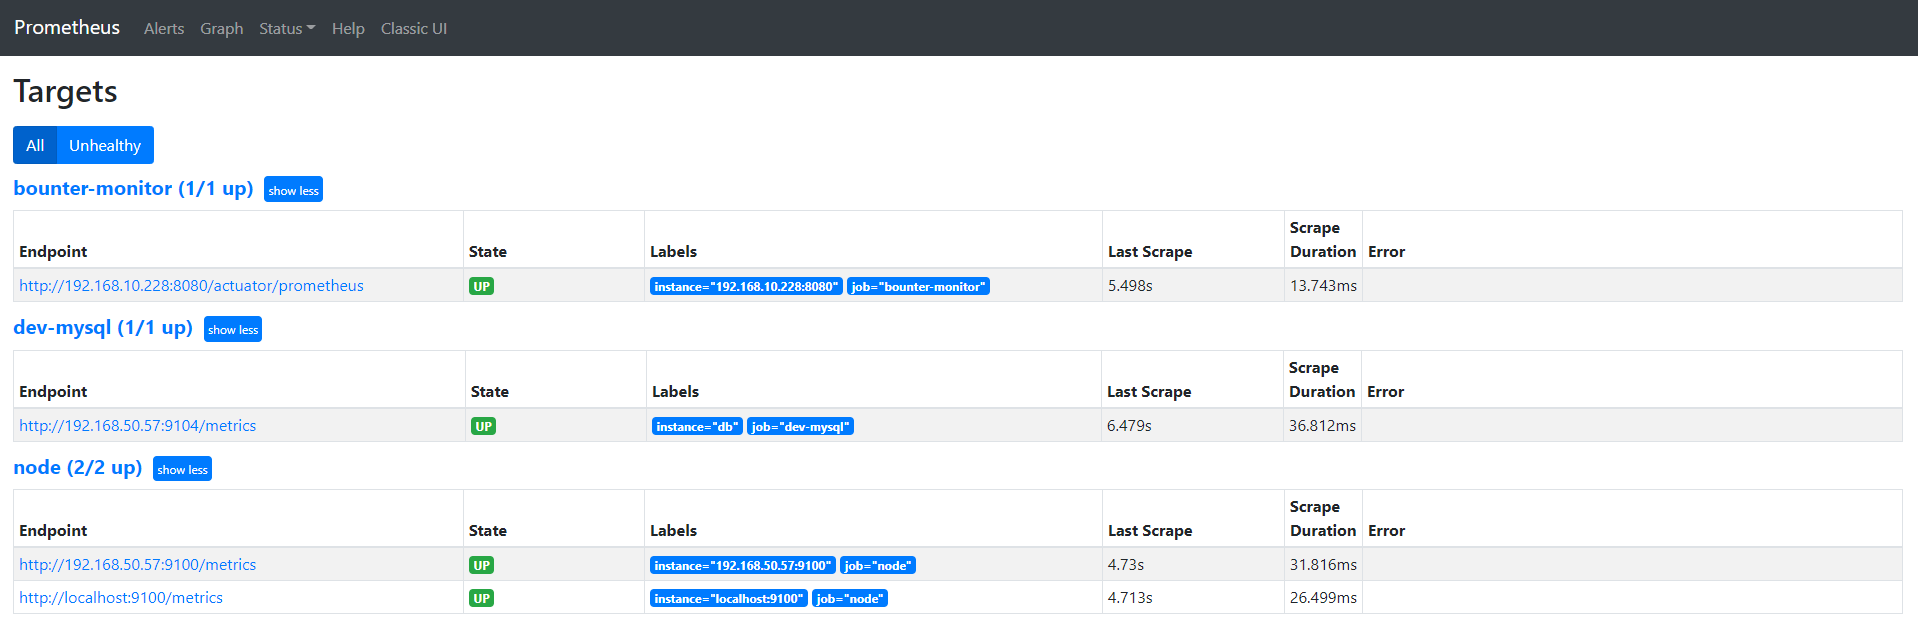
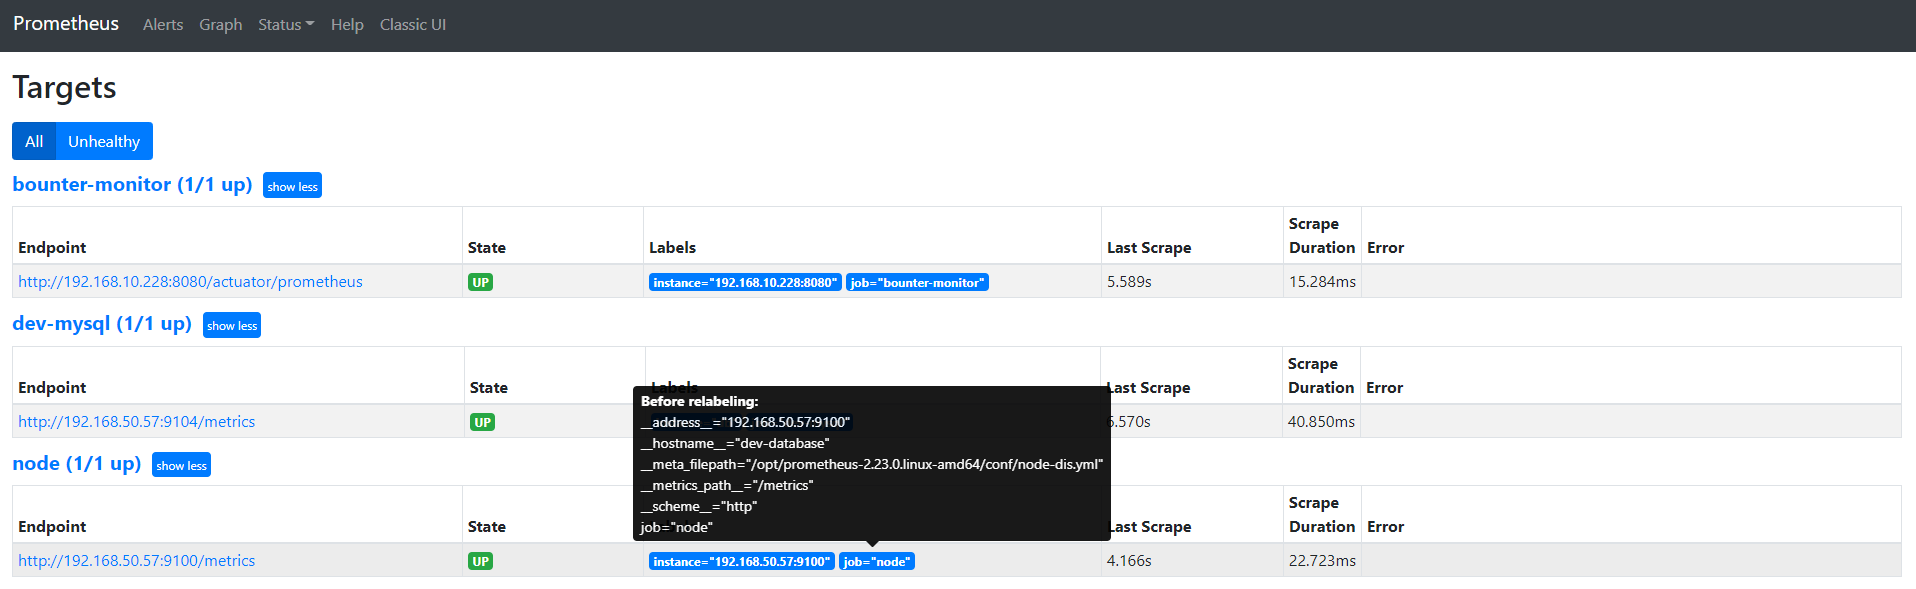
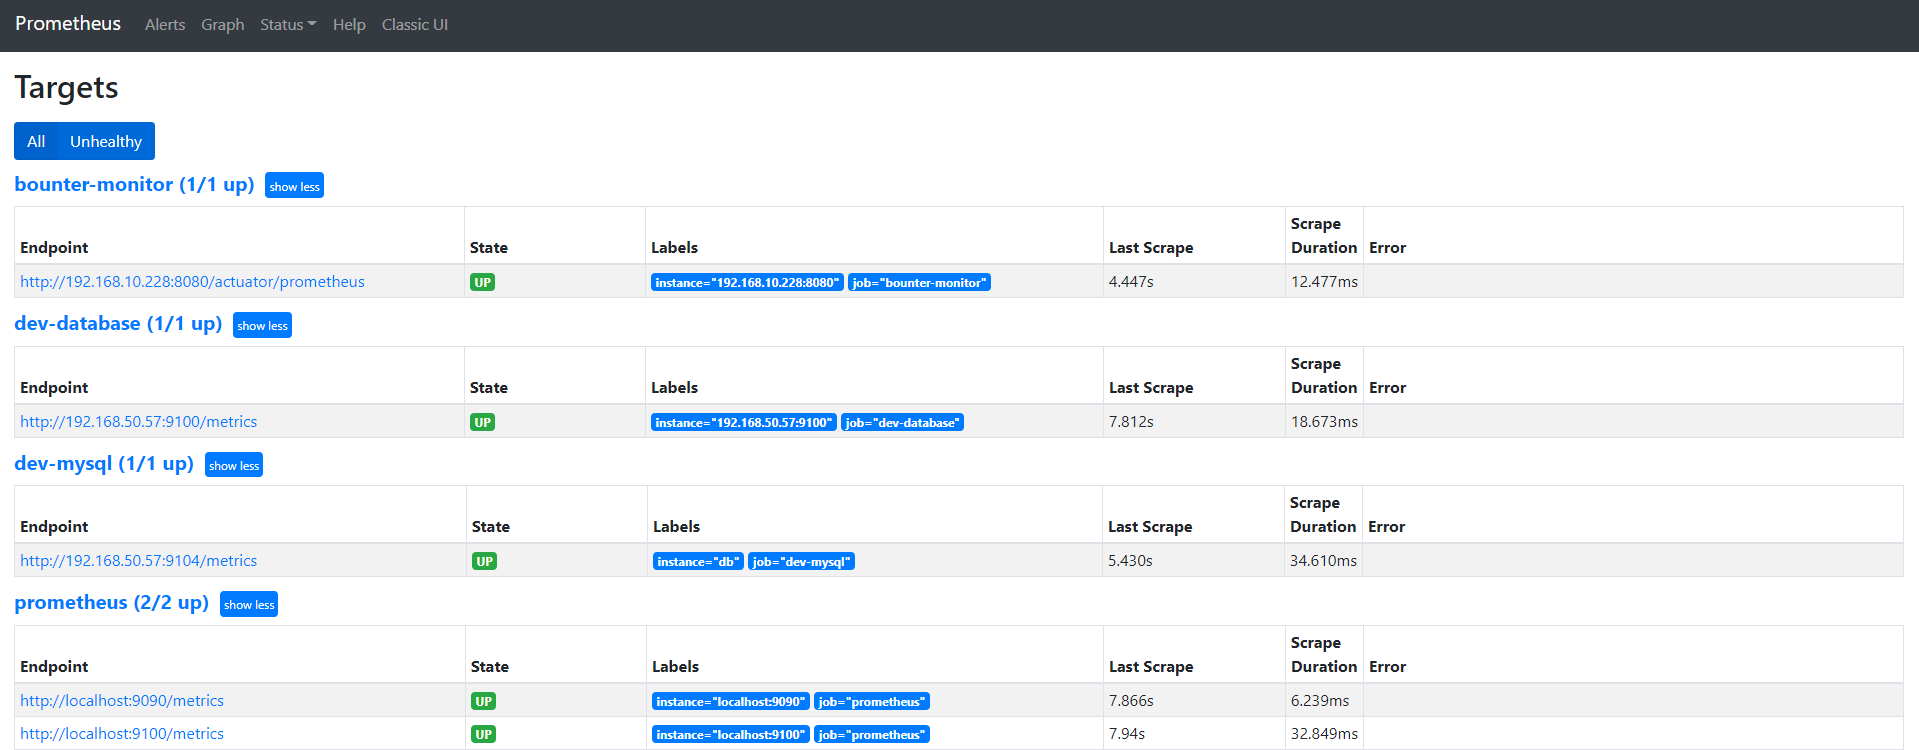
cat prometheus.yml 
# my global config
global:
scrape_interval: 15s # Set the scrape interval to every 15 seconds. Default is every 1 minute.
evaluation_interval: 15s # Evaluate rules every 15 seconds. The default is every 1 minute.
# scrape_timeout is set to the global default (10s).
# Alertmanager configuration
alerting:
alertmanagers:
- static_configs:
- targets:
- localhost:9093 # 这里修改为 localhost
# Load rules once and periodically evaluate them according to the global 'evaluation_interval'.
rule_files:
# - "first_rules.yml"
# - "second_rules.yml"
- "/usr/local/prometheus/rule.yml"
# A scrape configuration containing exactly one endpoint to scrape:
# Here it's Prometheus itself.
scrape_configs:
# The job name is added as a label `job=<job_name>` to any timeseries scraped from this config.
- job_name: 'prometheus'
# metrics_path defaults to '/metrics'
# scheme defaults to 'http'.
static_configs:
- targets: ['localhost:9090','localhost:9100']
- job_name: 'dev-database'
scrape_interval: 5s
static_configs:
- targets: ['192.168.50.57:9100']

重启 Prometheus 服务:

1
systemctl restart prometheus

4,编写邮件模板

注意:文件后缀为 tmpl

1
2
3
4
5
6
mkdir -pv /alertmanager/template/
vim /alertmanager/template/alert.tmpl
<table>
<tr><td>报警名</td><td>开始时间</td></tr>
<tr><td></td><td></td></tr>
</table>

5,启动 Alertmanager

1
2
3
systemctl daemon-reload
systemctl start alertmanager.service
systemctl status alertmanager.service

6,验证效果。

此时到管理界面可以看到如下信息:

然后停止dev-database节点上的 node_exporter 服务,然后再看效果。

1
systemctl stop node_exporter.service

接着邮箱应该会收到邮件:

监控Linux

在机器上安装NodeExporter,然后在Prometheus.yml配置监控地址

1
2
3
4
5
vi /usr/local/prometheus/prometheus.yml

- job_name: 'dev-database'
static_configs:
- targets: ['192.168.50.57:9100']

在prometheus中, 可以抓取的端点成为实例,通常情况下具有相同目的的实例的集合成为job。

1
2
3
4
5
vi /usr/local/prometheus/prometheus.yml

- job_name: 'dev-database'
static_configs:
- targets: ['192.168.50.57:9100','192.168.50.58:9100','192.168.50.59:9100']

使用https://grafana.com/grafana/dashboards/11074进行监控

Grafana导入模板监控

上传json文件,选择Prometheus

监控Mysql
1
2
3
4
##下载mysql_exporter
wget https://github.com/prometheus/mysqld_exporter/releases/download/v0.12.1/mysqld_exporter-0.12.1.linux-amd64.tar.gz
tar zxvf mysqld_exporter-0.12.1.linux-amd64.tar.gz
mv mysqld_exporter-0.12.1.linux-amd64 /usr/local/mysqld_exporter

授权连接

想要获取监控数据,需要授权程序能够连接到MySQL。

1
2
3
GRANT REPLICATION CLIENT, PROCESS ON *.* TO 'exporter'@'localhost' identified by '123456';
GRANT SELECT ON performance_schema.* TO 'exporter'@'localhost';
flush privileges;

注意:这里只授权了本地登陆,说明这个授权适用于mysql_exporter监控工具部署在MySQL Server上的情况,如果是部署在Prometheus Server上,则需要授权远程登陆。

创建配置信息文件

1
2
3
4
5
cd /usr/local/mysqld_exporter
vim .my.cnf
[client]
user=exporter
password=123456

使用systemd启动

1
2
3
4
5
6
7
8
9
10
11
12
13
vim /usr/lib/systemd/system/mysqld_exporter.service

[Unit]
Description=mysqld_exporter
After=network.target

[Service]
Type=simple
ExecStart=/usr/local/mysqld_exporter/mysqld_exporter --config.my-cnf=/usr/local/mysqld_exporter/.my.cnf
Restart=on-failure

[Install]
WantedBy=multi-user.target

加载配置并启动。

1
2
3
4
systemctl daemon-reload
systemctl start mysqld_exporter
systemctl status mysqld_exporter
systemctl enable mysqld_exporter

配置prometheus.yml添加监控目标

1
2
3
4
5
6
vi /usr/local/prometheus/prometheus.yml
- job_name: 'mysql'
static_configs:
- targets: ['192.168.50.57:9104']
labels:
instance: db

重启服务

1
systemctl restart prometheus

下载模板https://grafana.com/api/dashboards/9623/revisions/4/download 导入Grafana

监控SpringBoot
  1. 添加如下依赖
1
2
3
4
5
6
7
8
9
10
11
<!--监控 begin-->
<dependency>
<groupId>org.springframework.boot</groupId>
<artifactId>spring-boot-starter-actuator</artifactId>
</dependency>
<!--Micrometer-->
<dependency>
<groupId>io.micrometer</groupId>
<artifactId>micrometer-registry-prometheus</artifactId>
</dependency>
<!--监控 end-->
  1. 配置监控
1
2
3
4
5
6
7
8
9
10
11
12
13
spring:
application:
name: bounter-monitor

## 暴露所有的actuator endpoints
management:
endpoints:
web:
exposure:
include: "*"
metrics:
tags:
application: ${spring.application.name}

3.打包并运行

1
2
mvn clean install
java -jar nmk0718.jar

4.配置Prometheus.yml

1
2
3
4
5
6
# SpringBoot Application
- job_name: 'bounter-monitor'
scrape_interval: 5s
metrics_path: '/actuator/prometheus'
static_configs:
- targets: ['localhost:8080']

重启Prometheus就可以在Grafana看到监控数据了

可使用https://grafana.com/grafana/dashboards/4701或https://grafana.com/grafana/dashboards/10280 模板

监控rabbitmq

下载

1
weget https://github.com/kbudde/rabbitmq_exporter/releases/download/v1.0.0-RC7/rabbitmq_exporter-1.0.0-RC7.linux-amd64.tar.gz

解压

1
tar zxvf rabbitmq_exporter-1.0.0-RC7.linux-amd64.tar.gz

运行exporter

1
RABBIT_USER=liangjian RABBIT_PASSWORD=liangjian360 OUTPUT_FORMAT=JSON PUBLISH_PORT=9099 RABBIT_URL=http://192.168.50.51:5672 nohup ./rabbitmq_exporter &

验证:浏览器访问 http://192.168.50.51:9099/metrics

配置监控

1
2
3
4
5
6
7
vi prometheus.yml

- job_name: 'rabbitmq'
scrape_interval: 60s
scrape_timeout: 60s
static_configs:
- targets: ['192.168.50.51:9099']

配置告警

1
2
3
4
5
6
7
8
9
10
11
12
13
vi rule.yml
groups:
- name: alert-rules.yml
rules:
- alert: "rabbitmq实例失败"
expr: up{job="rabbitmq"} == 0
for: 5s
labels:
alertname: test_rabbitmq_monitor
severity: "critical"
annotations:
description: "rabbitmq {{ $labels.instance }} is error"
summary: "测试rabbitmq监控宕机"

验证

监控redis

下载地址:https://github.com/oliver006/redis_exporter/releases

1
2
3
4
5
6
7
8
9
10
11
12
13
14
[root@database opt]# tar zxvf redis_exporter-v1.13.1.linux-amd64.tar.gz 
redis_exporter-v1.13.1.linux-amd64/
redis_exporter-v1.13.1.linux-amd64/README.md
redis_exporter-v1.13.1.linux-amd64/redis_exporter
redis_exporter-v1.13.1.linux-amd64/LICENSE
[root@database opt]# cd redis_exporter-v1.13.1.linux-amd64/
[root@database redis_exporter-v1.13.1.linux-amd64]# ls
LICENSE README.md redis_exporter
[root@database redis_exporter-v1.13.1.linux-amd64]# nohup ./redis_exporter -redis.addr 192.168.50.51:6379 -redis.password liangjian360 &
[1] 208232
[root@database redis_exporter-v1.13.1.linux-amd64]# nohup: ignoring input and appending output to ‘nohup.out’
^C
[root@database redis_exporter-v1.13.1.linux-amd64]# netstat -lntp
tcp6 0 0 :::9121 :::* LISTEN 208232/./redis_expo

配置prometheus.yml

1
2
3
4
5
6
[root@monitor prometheus-2.23.0.linux-amd64]# vi prometheus.yml
- job_name: 'redis'
static_configs:
- targets: ['192.168.50.51:9121']

[root@monitor prometheus-2.23.0.linux-amd64]# systemctl restart prometheus

查看Targets

配置Grafana,使用https://grafana.com/grafana/dashboards/11835

配置alertmanager

1
2
3
4
5
6
7
8
9
10
[root@monitor prometheus-2.23.0.linux-amd64]# cat rule.yml 
- alert: "redis实例失败"
expr: up{job="redis"} == 0
for: 5s
labels:
alertname: redis_monitor
severity: "critical"
annotations:
description: "redis {{ $labels.instance }} is error"
summary: "测试redis监控宕机"

停止redis监控后,收到告警邮件