windows windows下杀掉指定应用 taskkill /im nginx.exe /f #/im 立即 /f 强制结束进程 #任务管理器>详细信息>内存>查看应用的pid
windows下杀掉指定端口的进程 for /f "tokens=5" %%i in ('netstat -aon ^| findstr ":9091"') do (set j=%%i) taskkill /t /f /pid %j% #netstat -aon | findstr ":port" 查找端口对应的pid #taskkill /t /f /pid 杀掉pid对应的进程
如有遇到删除文件,提示正在被使用 任务管理器>性能>打开资源监视器>CPU>关联的句柄 搜索需要删除的文件夹名称或文件名称
如有遇到某进程占用内存过大,并不清楚应用情况下 任务管理器>详细信息>内存>查看应用的pid 任务管理器>>性能>打开资源监视器>概述>磁盘>按pid排序 即可看到pid对应的启动文件和目录
如有遇到使用windows远程,不可复制粘贴情况 任务管理器>用户>nmk>RDP剪贴板监视程序 结束掉RDP,使用windows+R运行rdpclip.exe即可
如有遇到windows黑屏或任务栏不见等情况 任务管理器>用户>nmk>windows资源管理器 结束掉windows资源管理器,使用windows+R运行explorer.exe即可
linux linux下查看ip ifconfig|grep 192|awk '{print $2}' curl ifconfig.me
linux下杀掉指定端口进程 port=48094 #根据端口号查询对应的pid pid=$(netstat -nlp | grep :$port | awk '{print $7}' | awk -F"/" '{ print $1 }'); #杀掉对应的进程,如果pid不存在,则不执行 if [ -n "$pid" ]; then kill -9 $pid; fi
linux查看应用进程 ps -ef|grep java #grep为过滤 java为启动的应用 #输出结果java后的数字为pid,如需结束,使用kill -9 pid netstat -lntp #查看当前应用使用的端口和pid
linux查看文件有多少行 wc -l filename #输出filename的行数 wc -c filename #输出filename的字节数 wc -m filename #输出filename的字符数 wc -w filename #输出filename的字数
linux查找文件 在使用linux时,经常需要进行文件查找。其中查找的命令主要有find和grep。两个命令是有区别的。 (1)find命令是根据文件的属性进行查找,如文件名,文件大小,所有者,所属组,是否为空,访问时间,修改时间等。 (2)grep是根据文件的内容进行查找,会对文件的每一行按照给定的模式(patter)进行匹配查找。 一.find命令 基本格式:find path expression 1.按照文件名查找 (1)find / -name httpd.conf #在根目录下查找文件httpd.conf,表示在整个硬盘查找 (2)find /etc -name httpd.conf #在/etc目录下文件httpd.conf (3)find /etc -name '*srm*' #使用通配符*(0或者任意多个)。表示在/etc目录下查找文件名中含有字符串‘srm’的文件 (4)find . -name 'srm*' #表示当前目录下查找文件名开头是字符串‘srm’的文件 2.按照文件特征查找 (1)find / -amin -10 # 查找在系统中最后10分钟访问的文件(access time) (2)find / -atime -2 # 查找在系统中最后48小时访问的文件 (3)find / -empty # 查找在系统中为空的文件或者文件夹 (4)find / -group cat # 查找在系统中属于 group为cat的文件 (5)find / -mmin -5 # 查找在系统中最后5分钟里修改过的文件(modify time) (6)find / -mtime -1 #查找在系统中最后24小时里修改过的文件 (7)find / -user fred #查找在系统中属于fred这个用户的文件 (8)find / -size +10000c #查找出大于10000000字节的文件(c:字节,w:双字,k:KB,M:MB,G:GB) (9)find / -size -1000k #查找出小于1000KB的文件 3.使用混合查找方式查找文件 参数有: !,-and(-a),-or(-o)。 (1)find /tmp -size +10000c -and -mtime +2 #在/tmp目录下查找大于10000字节并在最后2分钟内修改的文件 (2)find / -user fred -or -user george #在/目录下查找用户是fred或者george的文件文件 (3)find /tmp ! -user panda #在/tmp目录中查找所有不属于panda用户的文件 二、grep命令 基本格式:find expression 1.主要参数 [options]主要参数: -c:只输出匹配行的计数。 -i:不区分大小写 -h:查询多文件时不显示文件名。 -l:查询多文件时只输出包含匹配字符的文件名。 -n:显示匹配行及行号。 -s:不显示不存在或无匹配文本的错误信息。 -v:显示不包含匹配文本的所有行。 pattern正则表达式主要参数: \: 忽略正则表达式中特殊字符的原有含义。 ^:匹配正则表达式的开始行。 $: 匹配正则表达式的结束行。 \<:从匹配正则表达 式的行开始。 \>:到匹配正则表达式的行结束。 [ ]:单个字符,如[A]即A符合要求 。 [ - ]:范围,如[A-Z],即A、B、C一直到Z都符合要求 。 .:所有的单个字符。 * :有字符,长度可以为0。 2.实例 (1)grep 'test' d* #显示所有以d开头的文件中包含 test的行 (2)grep ‘test’ aa bb cc #显示在aa,bb,cc文件中包含test的行 (3)grep ‘[a-z]\{5\}’ aa #显示所有包含每行字符串至少有5个连续小写字符的字符串的行 (4)grep magic /usr/src #显示/usr/src目录下的文件(不含子目录)包含magic的行 (5)grep -r magic /usr/src #显示/usr/src目录下的文件(包含子目录)包含magic的行 (6)grep -w pattern files :只匹配整个单词,而不是字符串的一部分(如匹配’magic’,而不是’magical’), 如果你想在当前目录下 查找"hello,world!"字符串,可以这样: grep -rn "hello,world!" * * : 表示当前目录所有文件,也可以是某个文件名 -r 是递归查找(如果不加-r表示只查找当前目录,不会递归的查找子目录) -n 是显示行号 -R 查找所有文件包含子目录 -i 忽略大小写 下面是一些有意思的命令行参数: grep -i pattern files :不区分大小写地搜索。默认情况区分大小写, grep -l pattern files :只列出匹配的文件名, grep -L pattern files :列出不匹配的文件名, grep -w pattern files :只匹配整个单词,而不是字符串的一部分(如匹配‘magic’,而不是‘magical’), grep -C number pattern files :匹配的上下文分别显示[number]行, grep pattern1 | pattern2 files :显示匹配 pattern1 或 pattern2 的行, grep pattern1 files | grep pattern2 :显示既匹配 pattern1 又匹配 pattern2 的行。
查看应用所占内存 [root@localhost ~]# ps -u postgres o pid,rss:8,cmd | awk 'NR>1 {A+=$2} {print} END{print "Total RSS: " A}' PID RSS CMD 3314 47100 /usr/pgsql-12/bin/postmaster -D /home/pgsql12/data/ 3318 544 postgres: logger 3320 76952 postgres: checkpointer 3321 57716 postgres: background writer 3322 16980 postgres: walwriter 3323 1664 postgres: autovacuum launcher 3324 1248 postgres: stats collector 3325 920 postgres: logical replication launcher 34905 23572 postgres: dbuser qiyewechat 192.168.138.1(59622) idle 39446 9936 postgres: dbuser qiyewechat 192.168.138.1(49408) idle 39449 16132 postgres: dbuser qiyewechat 192.168.138.1(49412) idle 42193 32336 postgres: dbuser ymall_test 192.168.138.1(52546) idle 42194 15376 postgres: dbuser ymall_test 192.168.138.1(52547) idle 42996 4492 postgres: dbuser ymall_test 192.168.138.1(54459) idle 43002 8260 postgres: dbuser ymall 192.168.138.1(54498) idle 43489 6604 postgres: dbuser ymall 192.168.138.1(55454) idle 43490 6612 postgres: dbuser ymall 192.168.138.1(55461) idle 43885 4496 postgres: dbuser ymall 192.168.138.1(56158) idle 43886 4496 postgres: dbuser ymall 192.168.138.1(56160) idle 43887 18624 postgres: dbuser ymall 192.168.138.1(56163) idle 43888 25448 postgres: dbuser ymall 192.168.138.1(56165) idle 43889 26704 postgres: dbuser ymall 192.168.138.1(56167) idle 44302 10696 postgres: dbuser qiyewechat 192.168.138.1(57075) idle 44369 14456 postgres: dbuser qiyewechat 192.168.138.1(57083) idle 44370 6028 postgres: dbuser qiyewechat 192.168.138.1(57084) idle 44478 4496 postgres: dbuser ymall_test 192.168.138.1(57323) idle 45814 8460 postgres: dbuser qiyewechat 192.168.138.1(59407) idle 45900 13064 postgres: dbuser qiyewechat 192.168.138.1(59474) idle 45907 5776 postgres: dbuser qiyewechat 192.168.138.1(59514) idle 45992 6344 postgres: dbuser ymall_test 192.168.138.1(59703) idle 46565 17660 postgres: dbuser ymall 192.168.138.1(60717) idle 46573 14536 postgres: dbuser ymall 192.168.138.1(60758) idle 46574 6048 postgres: dbuser ymall 192.168.138.1(60759) idle 47215 4504 postgres: dbuser ymall_test 192.168.138.1(61764) idle 47879 9428 postgres: dbuser ymall_test 192.168.138.1(63113) idle 47880 15380 postgres: dbuser ymall_test 192.168.138.1(63114) idle 48631 4496 postgres: dbuser ymall_test 192.168.138.1(64278) idle 49247 6076 postgres: dbuser postgres 192.168.138.1(65312) idle 49890 18168 postgres: dbuser ymall 192.168.138.1(50169) idle 49893 14576 postgres: dbuser ymall 192.168.138.1(50175) idle 49894 5816 postgres: dbuser ymall 192.168.138.1(50176) idle 50162 4492 postgres: dbuser ymall_test 192.168.138.1(50486) idle 50710 10560 postgres: dbuser ymall 192.168.138.1(51809) idle 50711 14512 postgres: dbuser ymall 192.168.138.1(51810) idle 50717 14816 postgres: dbuser ymall 192.168.138.1(51826) idle 50718 7660 postgres: dbuser ymall 192.168.138.1(51827) idle 50719 5824 postgres: dbuser postgres 192.168.138.1(51828) idle 50723 6064 postgres: dbuser ymall 192.168.138.1(51833) idle 51657 4500 postgres: dbuser ymall_test 192.168.138.1(53646) idle 53083 4504 postgres: dbuser ymall_test 192.168.138.1(56425) idle 53091 8468 postgres: dbuser ymall 192.168.138.1(56449) idle 53092 14500 postgres: dbuser ymall 192.168.138.1(56450) idle 53093 6048 postgres: dbuser ymall 192.168.138.1(56451) idle 62156 4228 postgres: dbuser ymall 192.168.138.1(57632) idle Total RSS: 698396
[root@prod-ghospital ~]#  ps -u mysql o pid,rss:8,cmd | awk 'NR>1 {A+=$2} {print} END{print "Total RSS: " A}'
  PID      RSS CMD
 3057  1496720 /usr/sbin/mysqld --daemonize --pid-file=/var/run/mysqld/mysqld.pid
Total RSS: 1496720
检测页面的状态码查看项目存活 [root@lepeng ~]# cat url.txt http://localhost:9980/front/test/aaaa2 [root@lepeng ~]# cat checkurl.sh fileurl='/root/url.txt' for chkurl in $(cat ${fileurl}) # ${}忽略空格 do # -o 输出内容到/dev/null; -s 静默方式 ;-w 定义显示输出格式;"%{http_code}" 在最后被检索的 HTTP(S) 页中被找到的数字的代码 HTTP_CODE=`curl -o /dev/null -s --head -w "%{http_code}" "${chkurl}"` if [ ${HTTP_CODE} -ne 200 ] then port=9980 echo `date "+%Y-%m-%d %H:%M:%S"` 项目正在重启..... >>check-result.txt #根据端口号查询对应的pid pid=$(netstat -nlp | grep :$port | awk '{print $7}' | awk -F"/" '{ print $1 }'); #杀掉对应的进程,如果pid不存在,则不执行 if [ -n "$pid" ]; then kill -9 $pid; fi cd /home/tomcat/lepeng_tomcat/tomcat-8.0.46-9980/bin/ ./startup.sh else echo -e `date "+%Y-%m-%d %H:%M:%S"` 当前状态码为${HTTP_CODE}: $chkurl >>check-result.txt fi done
加入定时任务
*/5 * * * * sh /root/checkurl.sh
#每5分钟执行一次检测脚本
#例如项目要3分钟,定时任务要大于3分钟,否则会一直重启
服务一直kill不掉 [root@prodl bin]# ps -ef|grep runsv root 7808 1 0 21:11 ? 00:00:00 runsvdir -P /opt/gitlab/service log: vlogd: warning: unable to lock directory: /var/log/gitlab/grafana: temporary failure svlogd: fatal: no functional log directories. svlogd: warning: unable to lock directory: /var/log/gitlab/grafana: temporary failure svlogd: fatal: no functional log directories. svlogd: warning: unable to lock directory: /var/log/gitlab/grafana: temporary failure svlogd: fatal: no functional log directories. root 7811 7808 0 21:11 ? 00:00:00 runsv gitaly root 7812 7808 0 21:11 ? 00:00:00 runsv alertmanager root 7813 7808 0 21:11 ? 00:00:00 runsv sidekiq root 7814 7808 0 21:11 ? 00:00:00 runsv postgresql root 7815 7808 0 21:11 ? 00:00:00 runsv unicorn root 7816 7808 0 21:11 ? 00:00:00 runsv prometheus root 7818 7808 0 21:11 ? 00:00:00 runsv postgres-exporter root 7819 7808 0 21:11 ? 00:00:00 runsv logrotate root 7820 7808 0 21:11 ? 00:00:00 runsv node-exporter root 7821 7808 0 21:11 ? 00:00:00 runsv gitlab-exporter root 7822 7808 0 21:11 ? 00:00:00 runsv gitlab-workhorse root 8329 7808 0 21:23 ? 00:00:00 runsv grafana
runsvdir -P /opt/gitlab/service log为主进程
这是一个runit service,kill -9 无法杀死。【runsvdir 进程杀死后又重新创建(杀不死)】
后来查看了官方文档中的说明后, 使用如下命令:
[root@prod-ghospital bin]# systemctl stop gitlab-runsvdir
[root@prod-ghospital bin]# ps -ef|grep runsv
root     12453  6424  0 21:36 pts/0    00:00:00 grep --color=auto runsv
[root@prod-ghospital bin]# netstat -lntp
Active Internet connections (only servers)
Proto Recv-Q Send-Q Local Address           Foreign Address         State       PID/Program name
tcp        0      0 127.0.0.1:25            0.0.0.0:*               LISTEN      4904/sendmail: acce
tcp        0      0 0.0.0.0:443             0.0.0.0:*               LISTEN      2081/nginx: master
tcp        0      0 127.0.0.1:20037         0.0.0.0:*               LISTEN      2534/java
tcp        0      0 0.0.0.0:6379            0.0.0.0:*               LISTEN      1350/redis-server *
tcp        0      0 0.0.0.0:80              0.0.0.0:*               LISTEN      2081/nginx: master
tcp        0      0 0.0.0.0:8081            0.0.0.0:*               LISTEN      2534/java
tcp        0      0 0.0.0.0:81              0.0.0.0:*               LISTEN      2081/nginx: master
tcp        0      0 0.0.0.0:22              0.0.0.0:*               LISTEN      2978/sshd
tcp6       0      0 127.0.0.1:9600          :::*                    LISTEN      18615/java
tcp6       0      0 :::9000                 :::*                    LISTEN      19159/java
tcp6       0      0 :::3306                 :::*                    LISTEN      2970/mysqld
tcp6       0      0 :::6379                 :::*                    LISTEN      1350/redis-server *
tcp6       0      0 :::9200                 :::*                    LISTEN      20071/java
tcp6       0      0 :::80                   :::*                    LISTEN      2081/nginx: master
tcp6       0      0 :::9300                 :::*                    LISTEN      19159/java
tcp6       0      0 :::9302                 :::*                    LISTEN      20071/java
系统负载大于等于4并且cpu>200% 重启程序
#!/bin/bash

#获取5分钟系统负载
sys_load=`/bin/cat /proc/loadavg | awk '{print $2}'`
#获取pot进程pid
pot=$(netstat -nlp | grep 10010 | awk '{print $7}' | awk -F"/" '{ print $1 }');
#获取shop进程pid
shop=$(netstat -nlp | grep 9980 | awk '{print $7}' | awk -F"/" '{ print $1 }');

#如果系统负载大于等于4并且cpu>200%杀掉该进程
if [ "$sys_load" > "4" ] || [ "$sys_load" = "4" ]; then

ps axf -o "pid %cpu" | awk '{if($2>=200.0) print $1}' | while read procid
do
kill -9 $procid
echo 系统负载+$sys_load >> /home/output.txt
echo cpu高的进程+ $procid >> /home/output.txt
echo `date`+"杀掉cpu高的进程" >> /home/output.txt

#如果pot进程不在 重启pot
if [ "$pot" = ""  ];  then
echo pot进程+$pot >> /home/output.txt
cd /home/tomcat/lepeng_tomcat/tomcat-8.0.46-10010/bin/
./startup.sh
echo `date`+"pot重启" >> /home/output.txt
fi

#如果shop进程不在 重启shop
if [ "$shop" = ""  ];  then
echo shop进程+$shop >> /home/output.txt
cd /home/tomcat/lepeng_tomcat/tomcat-8.0.46-9980/bin/
./startup.sh
echo `date`+"shop重启" >> /home/output.txt
fi

done

fi
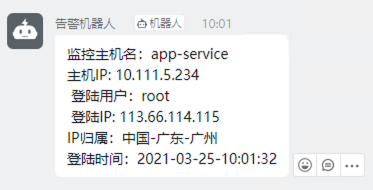
ssh登陆即进行告警通知 编写相关脚本内容如下:
#!/bin/bash
#msg='监控服务器登录用户:\n主机名: '`hostname`'\n监控主机IP: '`ifconfig eth0|awk -F '[ :]+' 'NR==2 {print $3}'`'\n监控登录用户: '`whoami`'\n监控登录IP: '`who am i |awk -F '[()]' '{print $2}'`'\n监控登录时间: '`date '+%Y-%m-%d-%H:%M:%S'`''
#获取相关登陆信息
name=`hostname`
ip=`ifconfig eth0|awk -F '[ :]+' 'NR==2 {print $3}'`
user=`whoami`
_ip=`who am i |awk -F '[()]' '{print $2}'`
_time=`date '+%Y-%m-%d-%H:%M:%S'`
#查询登陆地址并返回相应信息
addr=`curl -q -s http://freeapi.ipip.net/$_ip | awk -F '"' '{print $2"-"$4"-"$6}'`
#自定义接入钉钉函数
function SendMessageToDingding(){
    #钉钉地址
        url="https://oapi.dingtalk.com/robot/send?access_token=11030e780f87aee0e5849dc488072940405c03aefa66341cde7e3a3d09916583"
    #推送到钉钉
        res=`curl -XPOST -s -L -H "Content-Type:application/json" -H "charset:utf-8" $url -d "
        {
        \"msgtype\": \"text\",
        \"text\": {
                 \"content\": \"监控主机名:$1\n主机IP: $2\n 登陆用户:$3\n 登陆IP: $4\nIP归属:$5\n登陆时间:$6\"
                 }
    }"`
        echo $res
}
#subject=`echo -e $msg`
body="ECS监控ssh登陆"
#SendMessageToDingding $subject $body
#调用函数
SendMessageToDingding $name $ip $user $_ip $addr $_time $body
将脚本文件放置在 /etc/profile.d/ 文件目录下,即可实现登陆时,发送相关告警至钉钉
效果如下: