elasticsearch集群搭建 elasticsearch 下载 https://artifacts.elastic.co/downloads/elasticsearch/elasticsearch-oss-7.8.0-linux-x86_64.tar.gz
注意下载带oss的开源版本
拷贝到安装目录 cp elasticsearch-7.8.0-linux-x86_64.tar.gz /opt/es
解压 cd /opt/es tar -zxvf elasticsearch-7.8.0-linux-x86_64.tar.gz
修改配置文件 vim elasticsearch-7.8.0/config/elasticsearch.yml
cluster.name : 集群名称,集群名称用于跟其他相同名字的节点构成整个集群.node.name : 节点名称, 是该elasticsearch实例的唯一标识path.data : 数据路径,指定文档,索引存放的位置。path.logs :日志路径,指定运行日志的存放目录network.host : 绑定地址http.port : http端口,默认9200discovery.seed_hosts : 集群主机列表cluster.initial_master_nodes : 初始化一个新的集群时选举master(第一个启动为master)http.cors.enabled : 是否支持跨域,是:true,在使用head插件时需要此配置node.master : 是否是master节点discovery.type: single-node 单节点使用此配置
配置如下
# ======================== Elasticsearch Configuration =========================
#
# NOTE: Elasticsearch comes with reasonable defaults for most settings.
#       Before you set out to tweak and tune the configuration, make sure you
#       understand what are you trying to accomplish and the consequences.
#
# The primary way of configuring a node is via this file. This template lists
# the most important settings you may want to configure for a production cluster.
#
# Please consult the documentation for further information on configuration options:
# https://www.elastic.co/guide/en/elasticsearch/reference/index.html
#
# ---------------------------------- Cluster -----------------------------------
#
# Use a descriptive name for your cluster:
#
cluster.name: elasticsearch
#
# ------------------------------------ Node ------------------------------------
#
# Use a descriptive name for the node:
#
node.name: node-100
#
# Add custom attributes to the node:
#
#node.attr.rack: r1
#
# ----------------------------------- Paths ------------------------------------
#
# Path to directory where to store the data (separate multiple locations by comma):
#
path.data: /home/elasticsearch/data
#
# Path to log files:
#
path.logs: /home/elasticsearch/logs
#
# ----------------------------------- Memory -----------------------------------
#
# Lock the memory on startup:
#
#bootstrap.memory_lock: true
#
# Make sure that the heap size is set to about half the memory available
# on the system and that the owner of the process is allowed to use this
# limit.
#
# Elasticsearch performs poorly when the system is swapping the memory.
#
# ---------------------------------- Network -----------------------------------
#
# Set the bind address to a specific IP (IPv4 or IPv6):
#
network.host: 172.17.53.225
#
# Set a custom port for HTTP:
#
#
http.port: 9100
#
# For more information, consult the network module documentation.
#
# --------------------------------- Discovery ----------------------------------
#
# Pass an initial list of hosts to perform discovery when this node is started:
# The default list of hosts is ["127.0.0.1", "[::1]"]
#
discovery.seed_hosts: ["172.17.53.225:9300","172.17.53.226:9300","172.17.53.227:9300"]
#ES7.x前使用discovery.zen.ping.unicast.hosts: ["192.168.1.130", "192.168.1.134"]
#
# Bootstrap the cluster using an initial set of master-eligible nodes:
#
cluster.initial_master_nodes: ["node-100", "node-101","node-102"]
#
# For more information, consult the discovery and cluster formation module documentation.
#
# ---------------------------------- Gateway -----------------------------------
#
# Block initial recovery after a full cluster restart until N nodes are started:
#
#gateway.recover_after_nodes: 3
#
# For more information, consult the gateway module documentation.
#
# ---------------------------------- Various -----------------------------------
#
# Require explicit names when deleting indices:
#
#action.destructive_requires_name: true
http.cors.enabled: true
#
node.master: true
⚠️注意discovery.seed_hosts处为集群交互端口,默认为9300,如需更改请把下面参数加入配置
#TCP的默认监听端口,默认 9300
transport.tcp.port: 9300
配置完成后,将整个文件copy到另外两个机器
Elasticsearch不允许使用root账号启动,因此需要建一个专用的账号。
adduser es
passwd gzlp
chown -R es ./elasticsearch-7.8.0
修改数据路径和日志路径的权限:
chown -R es /home/elasticsearch/data
chown -R es /home/elasticsearch/logs
增加插件
https://github.com/medcl/elasticsearch-analysis-ik/releases
https://github.com/medcl/elasticsearch-analysis-pinyin/releases
https://github.com/medcl/elasticsearch-analysis-stconvert/releases
下载es版本一致的包,解压.移动到elasticsearch-7.8.0/plugins里
重命名elasticsearch-analysis-ik为ik
重命名elasticsearch-analysis-pinyin为pinyin
重命名elasticsearch-analysis-stconvert为stconvert
修改配置sysctl.conf
添加配置
执行命令
启动elasticsearch
验证是否启动成功
http://172.17.53.255:9100
验证是否为集群
http://172.17.53.255:9100/_cluster/stats?pretty
验证是否为主节点
http://172.17.53.226:9200/_cat/nodes?v

#带*星号表明该节点是主节点。带-表明该节点是从节点。
#另外还是heap.percent堆内存使用情况,ram.percent运行内存使用情况,cpu使用情况。

ip            heap.percent ram.percent cpu load_1m load_5m load_15m node.role master name
172.17.53.227           61          78   0    0.04    0.30     0.38 dimr      *      node-3
172.17.53.226           69          90   1    0.21    0.84     1.03 dimr      -      node-2
172.17.53.225           34          92   1    0.20    0.32     0.18 dimr      -      node-1
开机自启
在/etc/init.d目录下新建文件elasticsearch
一般的服务器在init.d这个目录下面好像都有没有elasticsearch这个文件,所以需要自己创建一个
1
export JAVA_HOME=/usr/java export CLASSPATH=.:$JAVA_HOME /lib/dt.jar:$JAVA_HOME /lib/tools.jar export PATH=$PATH: $JAVA_HOME /bin case "$1 " in start ) su es<<! cd /opt/es ./bin/elasticsearch -d ! echo "elasticsearch startup" ;; stop) es_pid=`ps aux|grep elasticsearch | grep -v 'grep elasticsearch' | awk '{print $2}' ` kill -9 $es_pid echo "elasticsearch stopped" ;; restart) es_pid=`ps aux|grep elasticsearch | grep -v 'grep elasticsearch' | awk '{print $2}' ` kill -9 $es_pid echo "elasticsearch stopped" su es<<! cd /opt/es ./bin/elasticsearch -d ! echo "elasticsearch startup" ;; *) echo "start|stop|restart" ;; esac exit $ ?
代码中的JAVA_HOME和JAVA_BIN路径需要根据自己的实际情况填写,su es这个要换成自己的服务器用户名,cd /usr/local/elasticsearch-7.7.1需要换成自己es的实际安装地址
在/etc/init.d/下面给elasticsearch赋予执行权限
chkconfig --add elasticsearch
将脚本加在 /etc/rc.local的后面
遇到的报错 错误信息: [1]: max file descriptors [4096] for elasticsearch process is too low, increase to at least [65535]
ERROR: [5] bootstrap checks failed
[1]: max file descriptors [4096] for elasticsearch process is too low, increase to at least [65535]
[2]: max number of threads [1024] for user [es] is too low, increase to at least [4096]
[3]: max virtual memory areas vm.max_map_count [65530] is too low, increase to at least [262144]
修改配置limits.conf
vi /etc/security/limits.conf
添加配置
* soft nofile 65536
* hard nofile 65536

* soft nproc 4096
* hard nproc 4096
#保存后需重新连接服务器
ElasticHD 下载 https://github.com/360EntSecGroup-Skylar/ElasticHD/releases
解压 unzip elasticHD_linux_amd64.zip
进入目录 mv ElasticHD /opt/ cd /opt/
后台启动 nohup ./ElasticHD -p 192.168.50.60:9800 &
Cerebro 下载 wget https://github.com/lmenezes/cerebro/releases/download/v0.9.2/cerebro-0.9.2.tgz
解压 tar zxvf cerebro-0.9.2.tgz
修改配置 vim cerebro-0.9.2/conf/application.conf
basePath : 定义访问路径 默认为/pidfile.path : pid路径data.path : 数据存放位置server.http.port : 访问端口 默认为9000network.host : 绑定地址username : 登录用户名password : 登录密码host : es集群地址name : 标识 一般用ES的cluster_name
示例
# Secret will be used to sign session cookies, CSRF tokens and for other encryption utilities.
# It is highly recommended to change this value before running cerebro in production.
secret = "ki:s:[[@=Ag?QI`W2jMwkY:eqvrJ]JqoJyi2axj3ZvOv^/KavOT4ViJSv?6YY4[N"

# Application base path
basePath = "/cerebro/"

# Defaults to RUNNING_PID at the root directory of the app.
# To avoid creating a PID file set this value to /dev/null
#pidfile.path = "/var/run/cerebro.pid"
pidfile.path=/dev/null

# Rest request history max size per user
rest.history.size = 50 // defaults to 50 if not specified

# Path of local database file
#data.path: "/var/lib/cerebro/cerebro.db"
data.path = "./cerebro.db"

play {
  # Cerebro port, by default it's 9000 (play's default)
  server.http.port = ${?CEREBRO_PORT}
}

es = {
  gzip = true
}

# Authentication
auth = {
  # either basic or ldap
  type: basic
  settings: {
    # Basic auth
    username = "gzlp"
    password = "gzlplink"
  }
}

# A list of known hosts
hosts = [
					{
							host = "http://172.17.53.225:9100"
							name = "gzlp-elasticsearch"
		}
]
后台启动 #后台启动 nohup ./bin/cerebro &
Logstash 采集日志 下载 wget https://artifacts.elastic.co/downloads/logstash/logstash-oss-7.8.0.tar.gz
解压 tar zxvf logstash-oss-7.8.0.tar.gz
配置logstash.yml http.host: "192.168.30.129" http.port: 9600
在bin目录下创建logstash.conf配置索引
#================================ input =====================================
input {
 beats {
   port => 5044
  }
}

#================================ output =====================================
output {
  if [fields][docType] == "sys-log" {
    elasticsearch {
      hosts => [ "172.17.53.226:9101" ]
          ###每天自动创建sys-log-年月日的索引,匹配到的模板是sys-log-*
      index => "sys-log-%{+YYYY.MM.dd}"
    }
  }
  if [fields][docType] == "point-log" {
    elasticsearch {
      hosts => [ "172.17.53.226:9101" ]
      ###每天自动创建point-log-年月日的索引,匹配到的模板是point-log-*
          index => "point-log-%{+YYYY.MM.dd}"
      routing => "%{type}"
    }
  }
  if [fields][docType] == "mysqlslowlogs" {
    elasticsearch {
      hosts => [ "172.17.53.226:9101" ]
          ###每天自动创建mysql-slowlog-年月日的索引,匹配到的模板是mysql-slowlog-*
      index => "mysql-slowlog-%{+YYYY.MM.dd}"
      manage_template => false
      document_type => "%{[@metadata][type]}"
    }
  }

  if [fields][docType] == "audit-log" {
    elasticsearch {
      hosts => ["172.17.53.226:9101"]
      manage_template => false
      index => "audit-log-%{+YYYY.MM.dd}"
      document_type => "%{[@metadata][type]}"
    }
}
}

#================================ filter =====================================
filter {
  if [type] == "syslog" {
        ##%{语法:语义}
    grok {
      match => { "message" => "%{SYSLOGTIMESTAMP:syslog_timestamp} %{SYSLOGHOST:syslog_hostname} %{DATA:syslog_program}(?:\[%{POSINT:syslog_pid}\])?: %{GREEDYDATA:syslog_message}" }
      add_field => [ "received_at", "%{@timestamp}" ]
      add_field => [ "received_from", "%{host}" ]
    }
    syslog_pri { }
    date {
      match => [ "syslog_timestamp", "MMM  d HH:mm:ss", "MMM dd HH:mm:ss" ]
    }
  }
  if [fields][docType] == "sys-log" {
    grok {
      patterns_dir => ["/home/logstash-7.8.0/config/patterns"]
      match => { "message" => "\[%{NOTSPACE:appName}:%{NOTSPACE:serverIp}:%{NOTSPACE:serverPort}\] %{TIMESTAMP_ISO8601:logTime} %{LOGLEVEL:logLevel} %{WORD:pid} \[%{MYAPPNAME:traceId}\] \[%{MYTHREADNAME:threadName}\] %{NOTSPACE:classname} %{GREEDYDATA:message}" }
      overwrite => ["message"]
    }
    date {
      match => ["logTime","yyyy-MM-dd HH:mm:ss.SSS Z"]
    }
    date {
      match => ["logTime","yyyy-MM-dd HH:mm:ss.SSS"]
      target => "timestamp"
      locale => "en"
      timezone => "+08:00"
    }
    mutate {
      remove_field => "logTime"
      remove_field => "@version"
      remove_field => "host"
      remove_field => "offset"
    }
  }

  if [fields][docType] == "point-log" {
    grok {
      patterns_dir => ["/home/logstash-7.8.0/config/patterns"]
        match => {
        "message" => "%{TIMESTAMP_ISO8601:logTime}\|%{MYAPPNAME:appName}\|%{WORD:resouceid}\|%{MYAPPNAME:type}\|%{GREEDYDATA:object}"
      }
    }
    kv {
        source => "object"
        field_split => "&"
        value_split => "="
    }
    date {
      match => ["logTime","yyyy-MM-dd HH:mm:ss.SSS Z"]
    }
    date {
      match => ["logTime","yyyy-MM-dd HH:mm:ss.SSS"]
      target => "timestamp"
      locale => "en"
      timezone => "+08:00"
    }
    mutate {
      remove_field => "message"
      remove_field => "logTime"
      remove_field => "@version"
      remove_field => "host"
      remove_field => "offset"
    }
  }

  ##mysqlslowlogs
  if [fields][docType] == "mysqlslowlogs" {
    grok {
        match => [
          "message", "^#\s+User@Host:\s+%{USER:user}\[[^\]]+\]\s+@\s+(?:(?<clienthost>\S*) )?\[(?:%{IP:clientip})?\]\s+Id:\s+%{NUMBER:id}\n# Query_time: %{NUMBER:query_time}\s+Lock_time: %{NUMBER:lock_time}\s+Rows_sent: %{NUMBER:rows_sent}\s+Rows_examined: %{NUMBER:rows_examined}\nuse\s(?<dbname>\w+);\nSET\s+timestamp=%{NUMBER:timestamp_mysql};\n(?<query_str>[\s\S]*)",
          "message", "^#\s+User@Host:\s+%{USER:user}\[[^\]]+\]\s+@\s+(?:(?<clienthost>\S*) )?\[(?:%{IP:clientip})?\]\s+Id:\s+%{NUMBER:id}\n# Query_time: %{NUMBER:query_time}\s+Lock_time: %{NUMBER:lock_time}\s+Rows_sent: %{NUMBER:rows_sent}\s+Rows_examined: %{NUMBER:rows_examined}\nSET\s+timestamp=%{NUMBER:timestamp_mysql};\n(?<query_str>[\s\S]*)",
          "message", "^#\s+User@Host:\s+%{USER:user}\[[^\]]+\]\s+@\s+(?:(?<clienthost>\S*) )?\[(?:%{IP:clientip})?\]\n# Query_time: %{NUMBER:query_time}\s+Lock_time: %{NUMBER:lock_time}\s+Rows_sent: %{NUMBER:rows_sent}\s+Rows_examined: %{NUMBER:rows_examined}\nuse\s(?<dbname>\w+);\nSET\s+timestamp=%{NUMBER:timestamp_mysql};\n(?<query_str>[\s\S]*)",
          "message", "^#\s+User@Host:\s+%{USER:user}\[[^\]]+\]\s+@\s+(?:(?<clienthost>\S*) )?\[(?:%{IP:clientip})?\]\n# Query_time: %{NUMBER:query_time}\s+Lock_time: %{NUMBER:lock_time}\s+Rows_sent: %{NUMBER:rows_sent}\s+Rows_examined: %{NUMBER:rows_examined}\nSET\s+timestamp=%{NUMBER:timestamp_mysql};\n(?<query_str>[\s\S]*)"
        ]
    }
    date {
      match => ["timestamp_mysql","yyyy-MM-dd HH:mm:ss.SSS","UNIX"]
    }
    date {
      match => ["timestamp_mysql","yyyy-MM-dd HH:mm:ss.SSS","UNIX"]
      target => "timestamp"
    }
    mutate {
      convert => ["query_time", "float"]
      convert => ["lock_time", "float"]
      convert => ["rows_sent", "integer"]
      convert => ["rows_examined", "integer"]
      remove_field => "message"
      remove_field => "timestamp_mysql"
      remove_field => "@version"
    }
  }

  ####audit-log
  if [fields][docType] == "audit-log" {
    grok {
      patterns_dir => ["/home/logstash-7.8.0/config/patterns"]
      match => {
        "message" => "%{TIMESTAMP_ISO8601:logTime}\|%{MYAPPNAME:appName}\|%{MYTHREADNAME:className}\|%{WORD:methodName}\|%{MYAPPNAME:userId}\|%{MYAPPNAME:userName}\|%{MYAPPNAME:clientId}\|%{GREEDYDATA:operation}"
      }
    }
    date {
      match => ["logTime","yyyy-MM-dd HH:mm:ss.SSS Z"]
    }
    date {
      match => ["logTime","yyyy-MM-dd HH:mm:ss.SSS"]
      target => "timestamp"
      locale => "en"
      timezone => "+08:00"
    }
    mutate {
      remove_field => "message"
      remove_field => "logTime"
      remove_field => "@version"
      remove_field => "host"
      remove_field => "offset"
    }
}

}
测试标准输入输出
./bin/logstash -e 'input { stdin {} } output { stdout { codec => rubydebug} }'

#输入
hellword

#输出结果
{
      "@version" => "1",
          "host" => "iZ2zehsi01vpevu3usi6etZ",
    "@timestamp" => 2020-07-09T02:49:10.957Z,
       "message" => "helloword"
}
测试输出到文件
./bin/logstash -e 'input { stdin{} } output { file { path => "/tmp/log-%{+YYYY.MM.dd}messages.gz"}}'

#输入
hellword

#输出结果
tail /tmp/log-2020.07.09messages.gz

{"host":"iZ2zehsi01vpevu3usi6etZ","message":"helloword","@version":"1","@timestamp":"2020-07-09T02:50:01.682Z"}
测试输出到elasticsearch
./bin/logstash -e 'input {  stdin{} } output { elasticsearch {hosts => ["172.17.53.225:9100"] index => "mytest-%{+YYYY.MM.dd}" }}'

#在es服务目录查看
ll /home/elasticsearch/data/nodes/0/indices/
total 4
drwxr-xr-x 4 es es 4096 Jul  9 10:55 mKYuiHd9Tj-qIH_h1sda9A
创建模版
curl -XPUT http://172.17.53.226:9101/_template/template_sys_log -d '
{
"index_patterns" : ["sys-log-*"],
"order" : 0,
"settings" : {
"number_of_replicas" : 0
},
"mappings": {
"properties": {
"message": {
"type": "text",
"fields": {
"keyword": {
"type": "keyword",
"ignore_above": 256
}
},
"analyzer": "ik_max_word"
},
"pid": {
"type": "text"
},
"serverPort": {
"type": "text"
},
"logLevel": {
"type": "text"
},
"traceId": {
"type": "text"
}
}
}
}' --header "Content-Type: application/json"

curl -XPUT http://172.17.53.226:9101/_template/template_point_log -d '
{

"index_patterns" : ["point-log-*"],

"order" : 0,

"settings" : {

"number_of_replicas" : 0

}

}' --header "Content-Type: application/json"
在config目录下创建patterns目录,在目录下创建mepattern.txt
# user-center
MYAPPNAME ([0-9a-zA-Z_-]*)
# RMI TCP Connection(2)-127.0.0.1
MYTHREADNAME ([0-9a-zA-Z._-]|\(|\)|\s)*
在bin目录下启动
./logstash -f logstash.conf
同步mysql 需要依赖mysql-connector-java-5.1.49.jar
在bin目录下创建jdbc.conf配置索引
# 输入部分
input {
  stdin {}
  jdbc {
    jdbc_default_timezone =>"Asia/Shanghai"

    # mysql数据库驱动
    jdbc_driver_library => "//root/mysql-connector-java-5.1.49.jar"
    jdbc_driver_class => "com.mysql.jdbc.Driver"
    # mysql数据库链接,数据库名
    jdbc_connection_string => "jdbc:mysql://219.128.77.86:7000/nethospital"
    # mysql数据库用户名,密码
    jdbc_user => "hospitalTest"
    jdbc_password => "Liangjian123360@8899"

    # 设置监听间隔  各字段含义(分、时、天、月、年),全部为*默认含义为每分钟更新一次
    schedule => "* * * * *"

    # 分页
    jdbc_paging_enabled => "true"
    # 分页大小
    jdbc_page_size => "50000"

    # sql语句执行文件,也可直接使用sql
        statement => 'select id,name,level,hospital_phone,update_time from h_hospital_outer WHERE update_time>=:sql_last_value order by update_time asc'
    # statement_filepath => "/usr/local/logstash-6.4.2/config/jdbc.sql"

    # elasticsearch索引类型名
    type => "hospital_outer_index"

        # 是否记录上次执行结果,true表示会将上次执行结果的tracking_column字段的值保存到last_run_metadata_path指定的文件中;
        record_last_run => true
        # 需要记录查询结果某字段的值时,此字段为true。
        use_column_value => true
        # 需要记录的字段,用于增量同步,需是数据库字段
        tracking_column => "update_time"
        # 递增字段的类型,numeric 表示数值类型, timestamp 表示时间戳类型
        tracking_column_type => timestamp
        # 同步点文件,这个文件记录了上次的同步点,重启时会读取这个文件,这个文件可以手动修改
        last_run_metadata_path => "/opt/logstash-7.8.0/config/hospital_outer_index_id"
        # 是否清除last_run_metadata_path的记录,需要增量同步时此字段必须为false;
        clean_run => false
  }
}

input {
  stdin {}
  jdbc {
    jdbc_default_timezone =>"Asia/Shanghai"

    # mysql数据库驱动
    jdbc_driver_library => "//root/mysql-connector-java-5.1.49.jar"
    jdbc_driver_class => "com.mysql.jdbc.Driver"
    # mysql数据库链接,数据库名
    jdbc_connection_string => "jdbc:mysql://219.128.77.86:7000/nethospital"
    # mysql数据库用户名,密码
    jdbc_user => "hospitalTest"
    jdbc_password => "Liangjian123360@8899"
    # 设置监听间隔  各字段含义(分、时、天、月、年),全部为*默认含义为每分钟更新一次
    schedule => "0 2 * * *"
    # 分页
    jdbc_paging_enabled => "true"
    # 分页大小
    jdbc_page_size => "50000"
    # sql语句执行文件,也可直接使用 statement => 'select * from h_hospital_outer'
        statement => 'select id,name,level,hospital_phone from h_hospital_outer'
    # statement_filepath => "/usr/local/logstash-6.4.2/config/jdbc.sql"
    # elasticsearch索引类型名
    type => "hospital_outer_index"
  }
}

# 过滤部分(不是必须项)
filter {
    ruby {
                code => "event.set('timestamp', event.get('@timestamp').time.localtime + 8*60*60)"
        }
        ruby {
                code => "event.set('@timestamp',event.get('timestamp'))"
        }
        ruby {
                code => "event.set('update_time',event.get('timestamp'))"
        }
        ruby {
                code => "event.set('create_time',event.get('timestamp'))"
        }
        mutate {
                remove_field => ["timestamp"]
        }
}

# 输出部分
output {
        if  [type] == "hospital_outer_index" {
                elasticsearch {
                        # elasticsearch索引名
                        index => "hospital_outer_index"
                        # 使用input中的type作为elasticsearch索引下的类型名
                        document_type => "%{type}"   # <- use the type from each input
                        # elasticsearch的ip和端口号
                        hosts => "192.168.50.60:9000"
                        # 同步mysql中数据id作为elasticsearch中文档id
                        document_id => "%{id}"
            }
        }

        stdout {
                codec => json_lines
        }
}
在bin目录下启动
遇到的报错 Error: Bad file descriptor - Bad file descriptor Exception错误
查看data下的是否有.lock文件
[root@es-1 ~]# ls -all /opt/logstash-7.8.0/data/
total 4
drwxr-xr-x.  4  631  503  69 Nov 13 12:58 .
drwxr-xr-x. 12  631  503 253 Nov 12 17:31 ..
drwxr-xr-x.  2 root root   6 Nov 12 17:31 dead_letter_queue
-rw-r--r--.  1 root root   0 Nov 13 12:58 .lock
drwxr-xr-x.  2 root root   6 Nov 12 17:31 queue
-rw-r--r--.  1 root root  36 Nov 12 17:31 uuid

删除.lock文件重新启动即可
日志出现报错:
[logstash.outputs.elasticsearch] retrying failed action with response code: 403 ({"type"=>"cluster_block_exception", "reason"=>"blocked by: [FORBIDDEN/12/index read-only / allow delete (api)];"})
ES说明文档:当ES数据所在目录磁盘空间使用率超过90%后,ES将修改为只读状态,所以初步判断是磁盘空间不足导致ES不允许写入。
解决:
服务器磁盘空间导致,清理服务器磁盘空间还是出现该报错问题
怀疑为es索引导致的不能同步数据
解决办法1 在kibana开发控制台执行下面语句即可
PUT _settings
    {
    "index": {
    "blocks": {
    "read_only_allow_delete": "false"
    }
    }
    }
解决方法2
如果kibana无法执行命令,可以使用下面命令解决
curl -XPUT -H "Content-Type: application/json" http://localhost:9200/_all/_settings -d '{"index.blocks.read_only_allow_delete": null}'
查看索引
curl http://192.168.50.70:9200/_cat/indices?v
health status index                uuid                   pri rep docs.count docs.deleted store.size pri.store.size
yellow open   h_hospital_outer     N4hbdo5TQnSazNx58_a5Qg   5   1     433934       126728    161.3mb        161.3mb
yellow open   m_medicine_info      swwieAn-TNG3FTTvpOlxwg   5   1      36556         1699     41.3mb         41.3mb
green  open   .kibana_1            OQh5HFwsRDSG0QAPKasZyg   1   0          1            0      3.7kb          3.7kb
yellow open   recommend_doctor_rsp vpIMBifjSySYU6h0j9nM-A   5   1        609            1    983.8kb        983.8kb
删除索引
curl -XDELETE localhost:9200/索引名
例如:
curl -XDELETE http://192.168.50.70:9200/m_medicine_info
curl -XDELETE http://192.168.50.70:9200/h_hospital_outer
curl -XDELETE http://192.168.50.70:9200/recommend_doctor_rsp
curl -XDELETE http://192.168.50.70:9200/.kibana_1
再次启动logstash,无报错,跟生产索引进行对比发现,有缺少,使用接口进行触发
es服务
医生模板生成接口:/api/es/doctor/refreshIndexAndDate
视频/文章模板生成接口:/app/video/article/refreshIndexAndDate
视频模板生成接口(已未使用):/app/video/refreshIndexAndDate

请求示例:
curl http://127.0.0.1:8908/app/video/article/refreshIndexAndDate

job服务
医生es全量同步:/job/doctor/synAllDoctorDates
视频/文章全量同步:/job/video/article/synAll
视频全量同步: /job/ljVideo/synAllVideo

请求示例:
curl http://127.0.0.1:8092/job/doctor/synAllDoctorDates
在容器的终端进行触发时,出现错误
Elasticsearch:None of the configured nodes are available:[{#transport#-1}
排查问题发现,通过nginx外放的端口映射为192.168.50.70:9200.
9200 是ES节点与外部通讯使用的端口。它是http协议的RESTful接口,各种CRUD操作都是走的该端口
9300是ES节点之间通讯使用的端口。它是tcp通讯端口,集群间和TCPclient都走的它。java程序中使用ES时,在配置文件中要配置该端口
更改nginx的端口映射为9300
stream {
    upstream es {
       server 192.168.50.70:9300 weight=1 max_fails=2 fail_timeout=120s;
    }
    server {
        listen  3304;
        proxy_connect_timeout 10s;
        proxy_timeout 300s;#设置客户端和代理服务之间的超时时间,如果5分钟内没操作将自动断开。
        proxy_pass es;
    }
}
后端再次请求接口同步数据正常
再次查看索引,索引都已经正常创建
[root@monitor ~]# curl http://192.168.50.70:9200/_cat/indices?v
health status index                uuid                   pri rep docs.count docs.deleted store.size pri.store.size
yellow open   app_video_article    -tQTMGs4SCKoLtNMJf-Aqw   5   1       2282            0      2.2mb          2.2mb
yellow open   h_hospital_outer     N4hbdo5TQnSazNx58_a5Qg   5   1     433934       126728    161.3mb        161.3mb
yellow open   m_medicine_info      swwieAn-TNG3FTTvpOlxwg   5   1      36556         1699     41.3mb         41.3mb
green  open   .kibana_1            OQh5HFwsRDSG0QAPKasZyg   1   0          1            0      3.7kb          3.7kb
yellow open   recommend_doctor_rsp vpIMBifjSySYU6h0j9nM-A   5   1        609            1    983.8kb        983.8kb
yellow open   mini_doctor_list     q0DGDN1_SZeIXyAeTNu8Dw   5   1          0            0      1.2kb          1.2kb
filebeat 下载 wget https://mirrors.huaweicloud.com/filebeat/7.8.0/filebeat-7.8.0-x86_64.rpm
安装 rpm -Uvh filebeat-7.8.0-x86_64.rpm
配置
vi /etc/filebeat/filebeat.yml filebeat.inputs: - type: log enabled: true # 检查文件更新的频率,默认是 10s scan_frequency: 10s #忽略过去 ignore_older 时间没有修改的文件,0(禁用),2h(2小时),5m(5分钟),168h(1周) ignore_older: 0 # 关闭过去 close_inactive 时间非活动状态的文件的 harvester close_inactive: 2m #单文件最大收集的字节数,超过将被丢弃,默认10MB=10485760,60MB=62914560,必须大于单文件最大大小 max_bytes: 62914560 #每个harvester在获取文件时使用的缓冲区大小字节数,默认值是16384,1MB=1048576 harvester_buffer_size: 1048576 paths: - /var/log/java/*/app.*log #exclude_lines: ['\s^DEBUG\s\d'] #fields_under_root: true fields: docType: sys-log project: microservices-platform multiline: #pattern: '^\[\S+:\S+:\d{2,}] ' pattern: '^\[' negate: true match: after - type: log enabled: true # 检查文件更新的频率,默认是 10s scan_frequency: 15s #忽略过去 ignore_older 时间没有修改的文件,0(禁用),2h(2小时),5m(5分钟),168h(1周) ignore_older: 0 # 关闭过去 close_inactive 时间非活动状态的文件的 harvester close_inactive: 2m #单文件最大收集的字节数,超过将被丢弃,默认10MB=10485760,60MB=62914560,必须大于单文件最大大小 max_bytes: 62914560 #每个harvester在获取文件时使用的缓冲区大小字节数,默认值是16384,1MB=1048576 harvester_buffer_size: 1048576 paths: - /var/log/java/*/point.*log #fields_under_root: true fields: docType: point-log project: microservices-platform - type: log enabled: true # 检查文件更新的频率,默认是 10s scan_frequency: 20s #忽略过去 ignore_older 时间没有修改的文件,0(禁用),2h(2小时),5m(5分钟),168h(1周) ignore_older: 0 # 关闭过去 close_inactive 时间非活动状态的文件的 harvester close_inactive: 2m #单文件最大收集的字节数,超过将被丢弃,默认10MB=10485760,60MB=62914560,必须大于单文件最大大小 max_bytes: 62914560 #每个harvester在获取文件时使用的缓冲区大小字节数,默认值是16384,1MB=1048576 harvester_buffer_size: 1048576 paths: - /var/log/java/*/audit.*log #fields_under_root: true fields: docType: audit-log project: microservices-platform #filebeat全局配置 max_procs: 1 queue.mem: #事件容量 events: 4096 #一次发送最小event数 flush.min_events: 512 #一次发送最大min_events等待时间 flush.timeout: 5s output.logstash: enabled: true # The Logstash hosts hosts: ["172.17.53.226:5044"] bulk_max_size: 2048 processors: - add_host_metadata: ~ - add_cloud_metadata: ~ - add_docker_metadata: ~ - add_kubernetes_metadata: default_indexers.enabled: false default_matchers.enabled: false
启动 filebeat -c /etc/filebeat/filebeat.yml -e 后台启动 nohup filebeat -c /etc/filebeat/filebeat.yml -e >filebeat.log 2>&1 &
kibana 下载地址:https://www.elastic.co/cn/downloads/kibana-oss
tar zxvf kibana-oss-7.8.0-linux-x86_64.tar.gz
配置 vim kibana-oss-7.8.0-linux-x86_64/config/kibana.ymlserver.port: 5600 #监听端口server.host: "172.17.53.226" #监听地址elasticsearch.hosts: ["http://172.17.53.225:9200","http://172.17.53.226:9200"] #elasticsearch服务器地址
启动 ./bin/kibana --allow-root
Kibana是一个开源的分析和可视化平台,设计用于和Elasticsearch一起工作。
你用Kibana来搜索,查看,并和存储在Elasticsearch索引中的数据进行交互。
你可以轻松地执行高级数据分析,并且以各种图标、表格和地图的形式可视化数据。
Kibana使得理解大量数据变得很容易。它简单的、基于浏览器的界面使你能够快速创建和共享动态仪表板,实时显示Elasticsearch查询的变化。
Kibana可视化管理页面详细使用说明
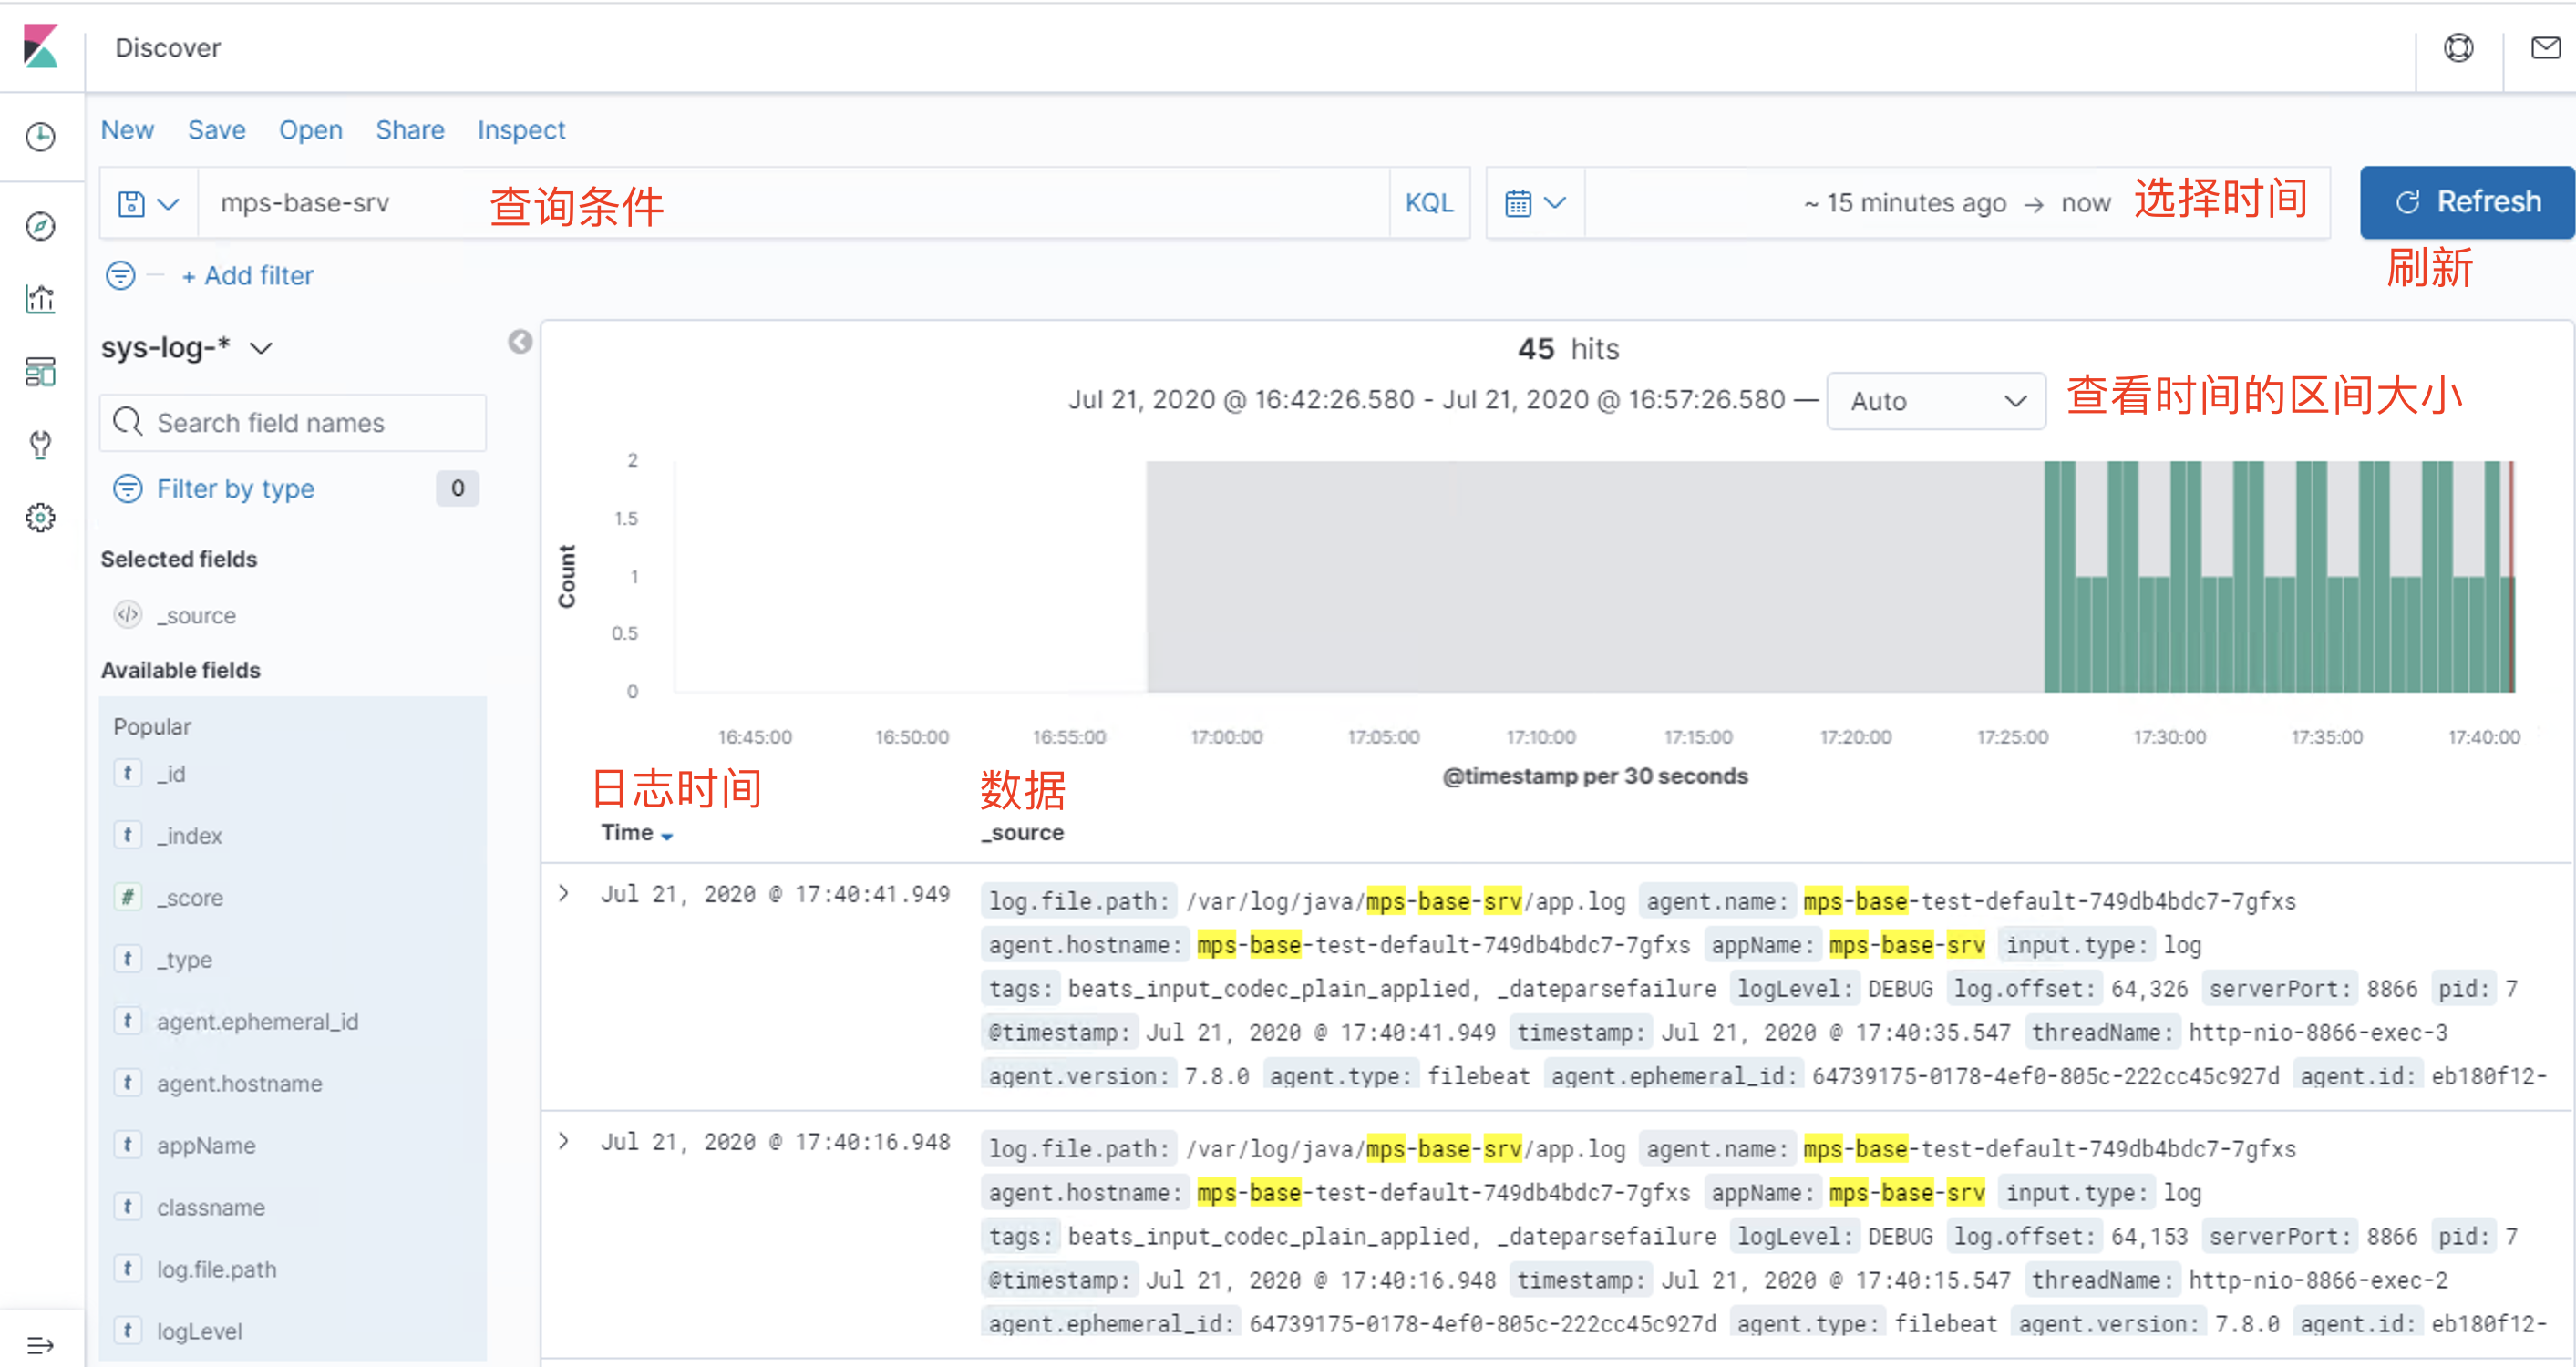
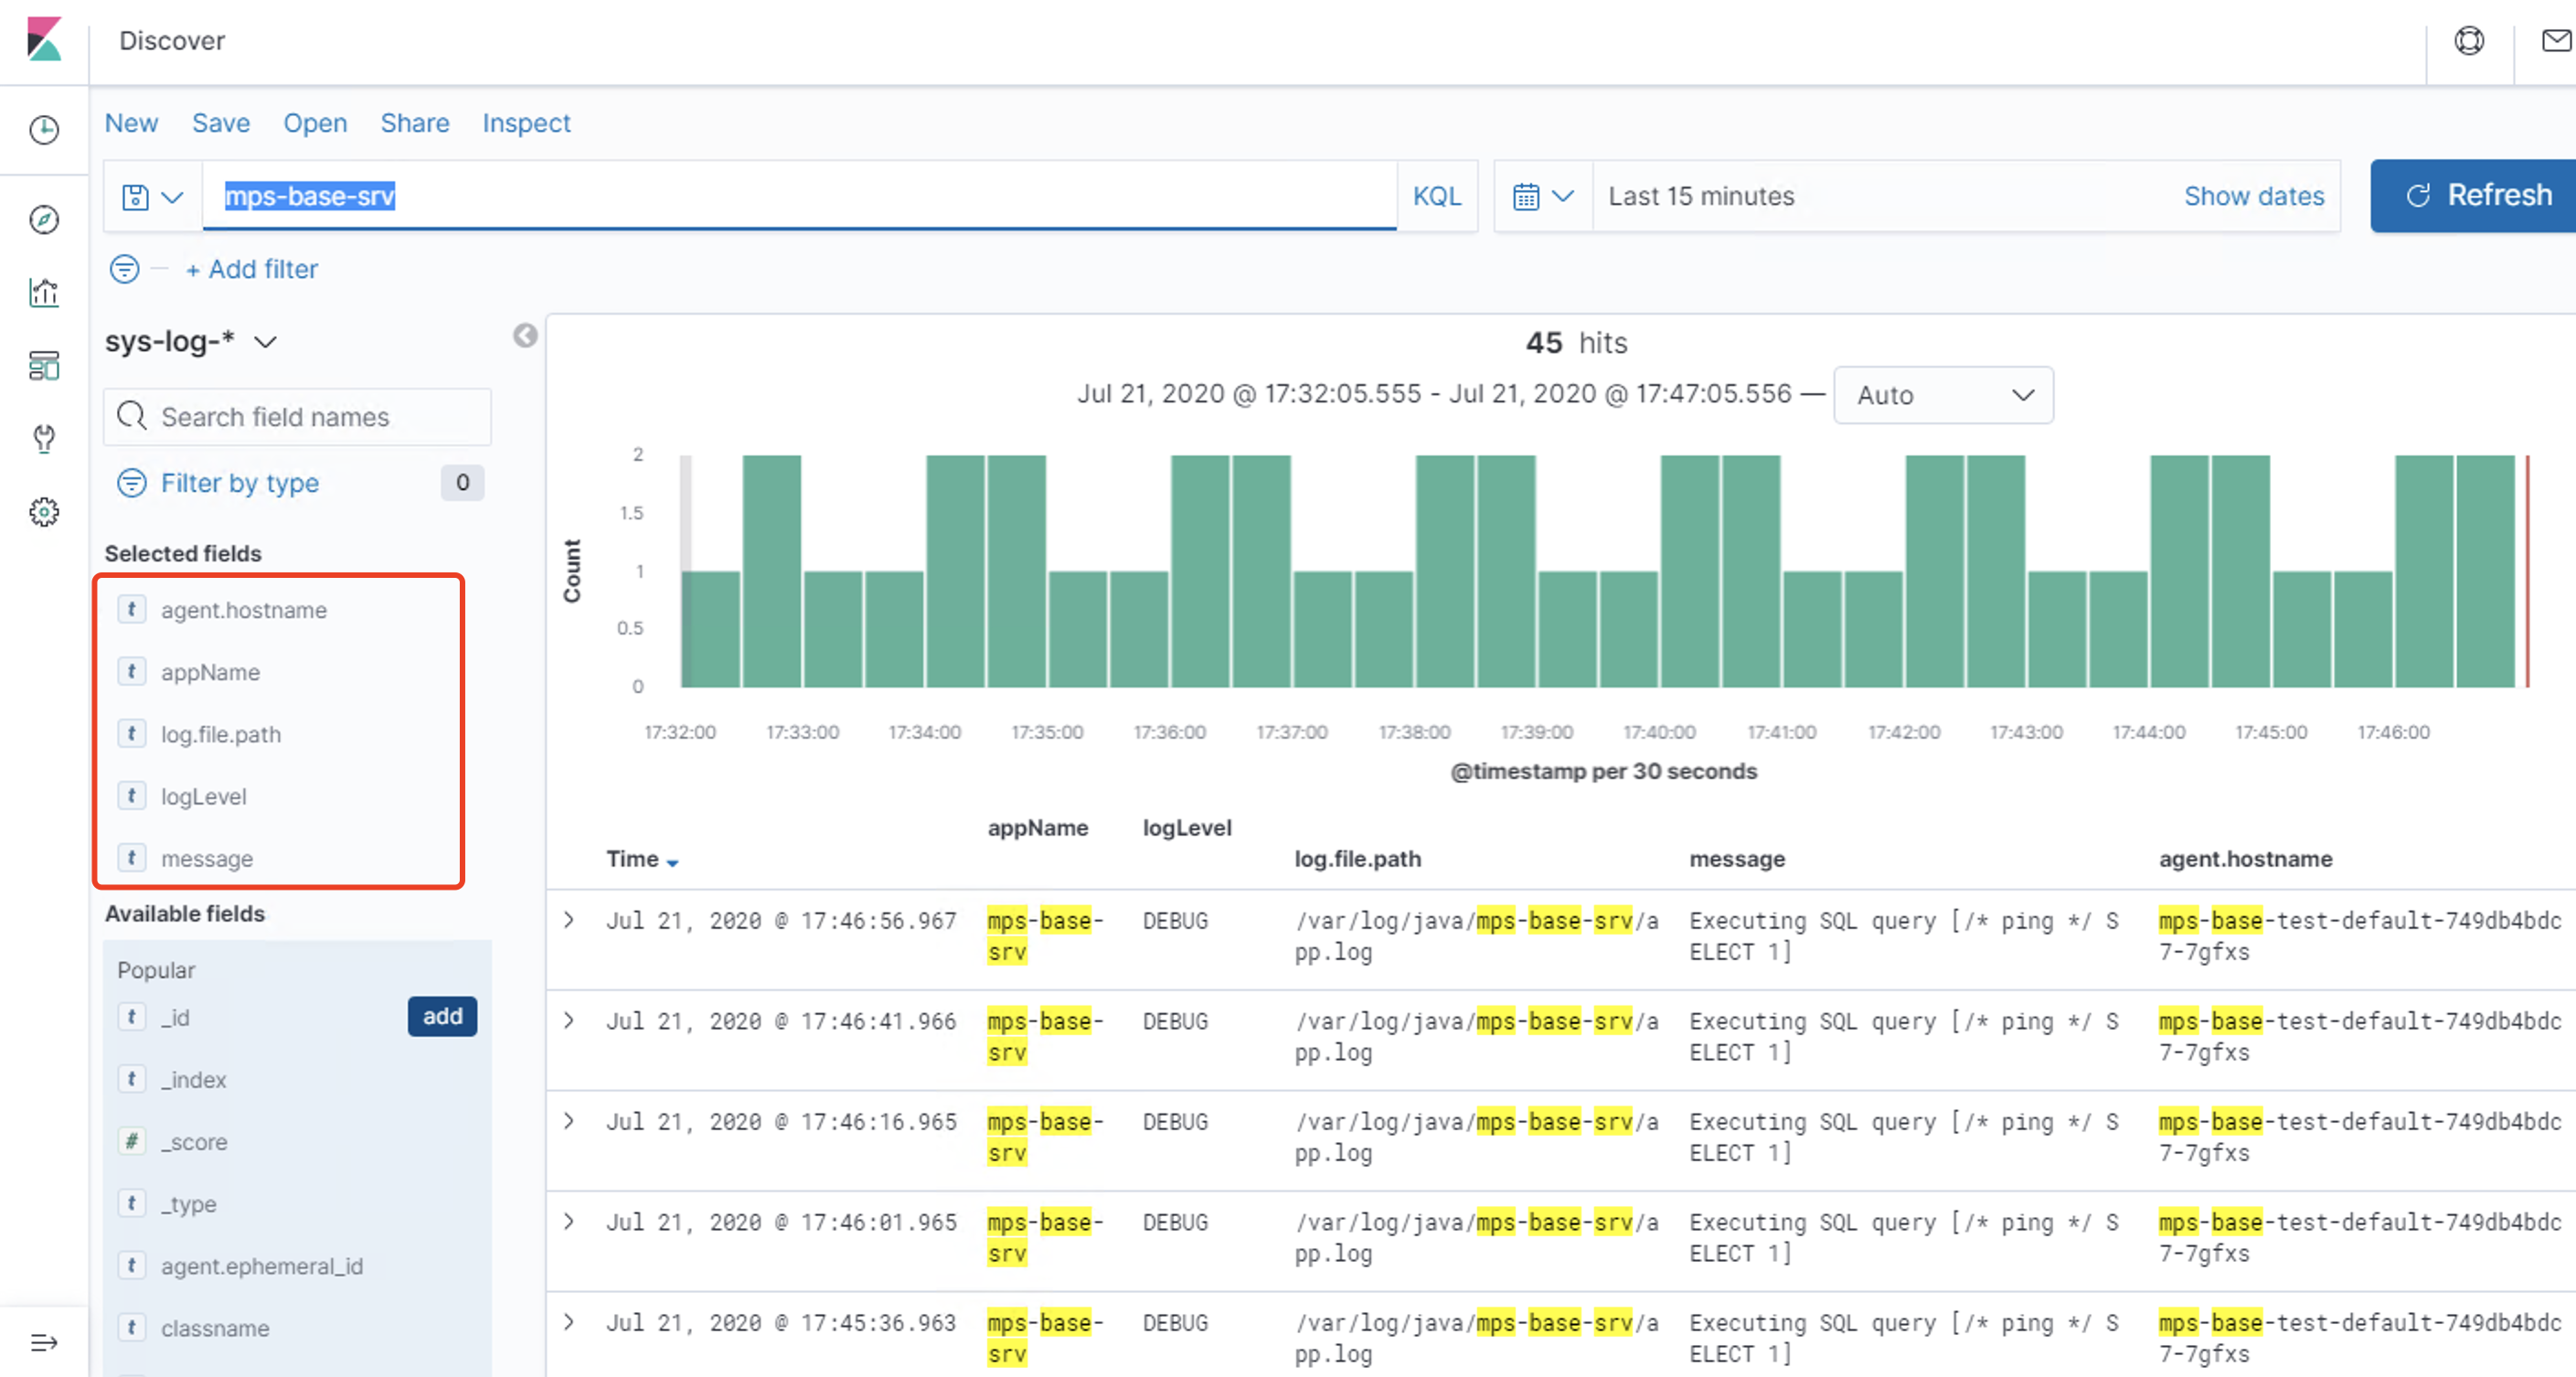
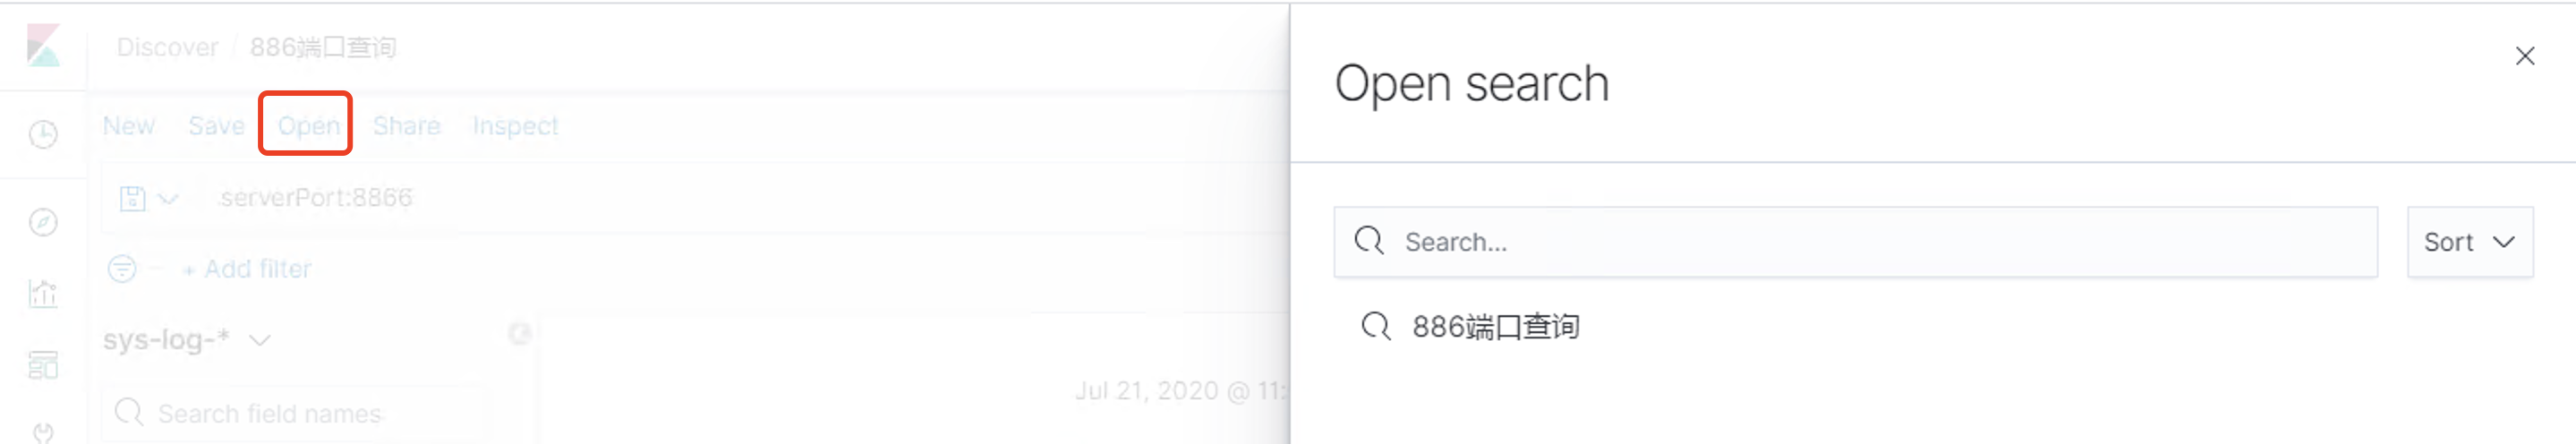
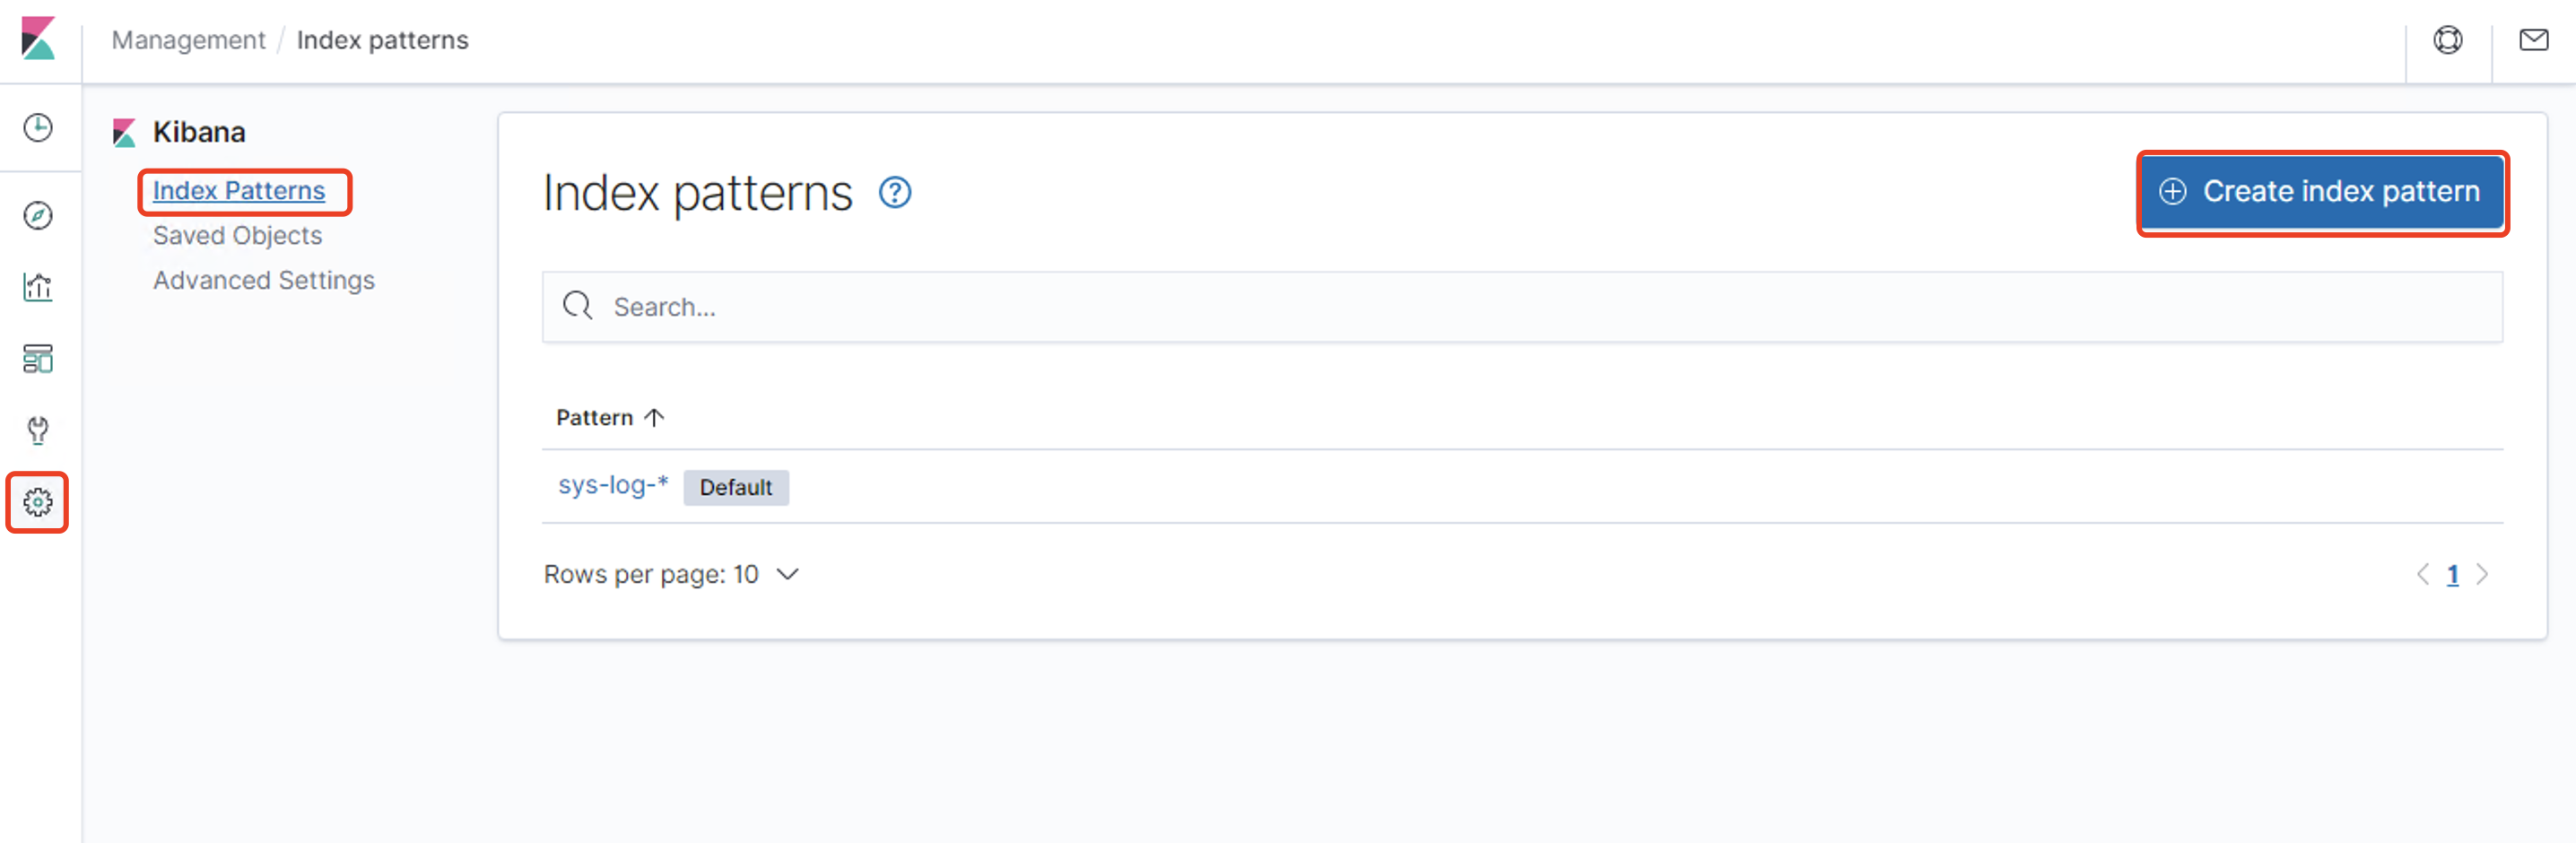
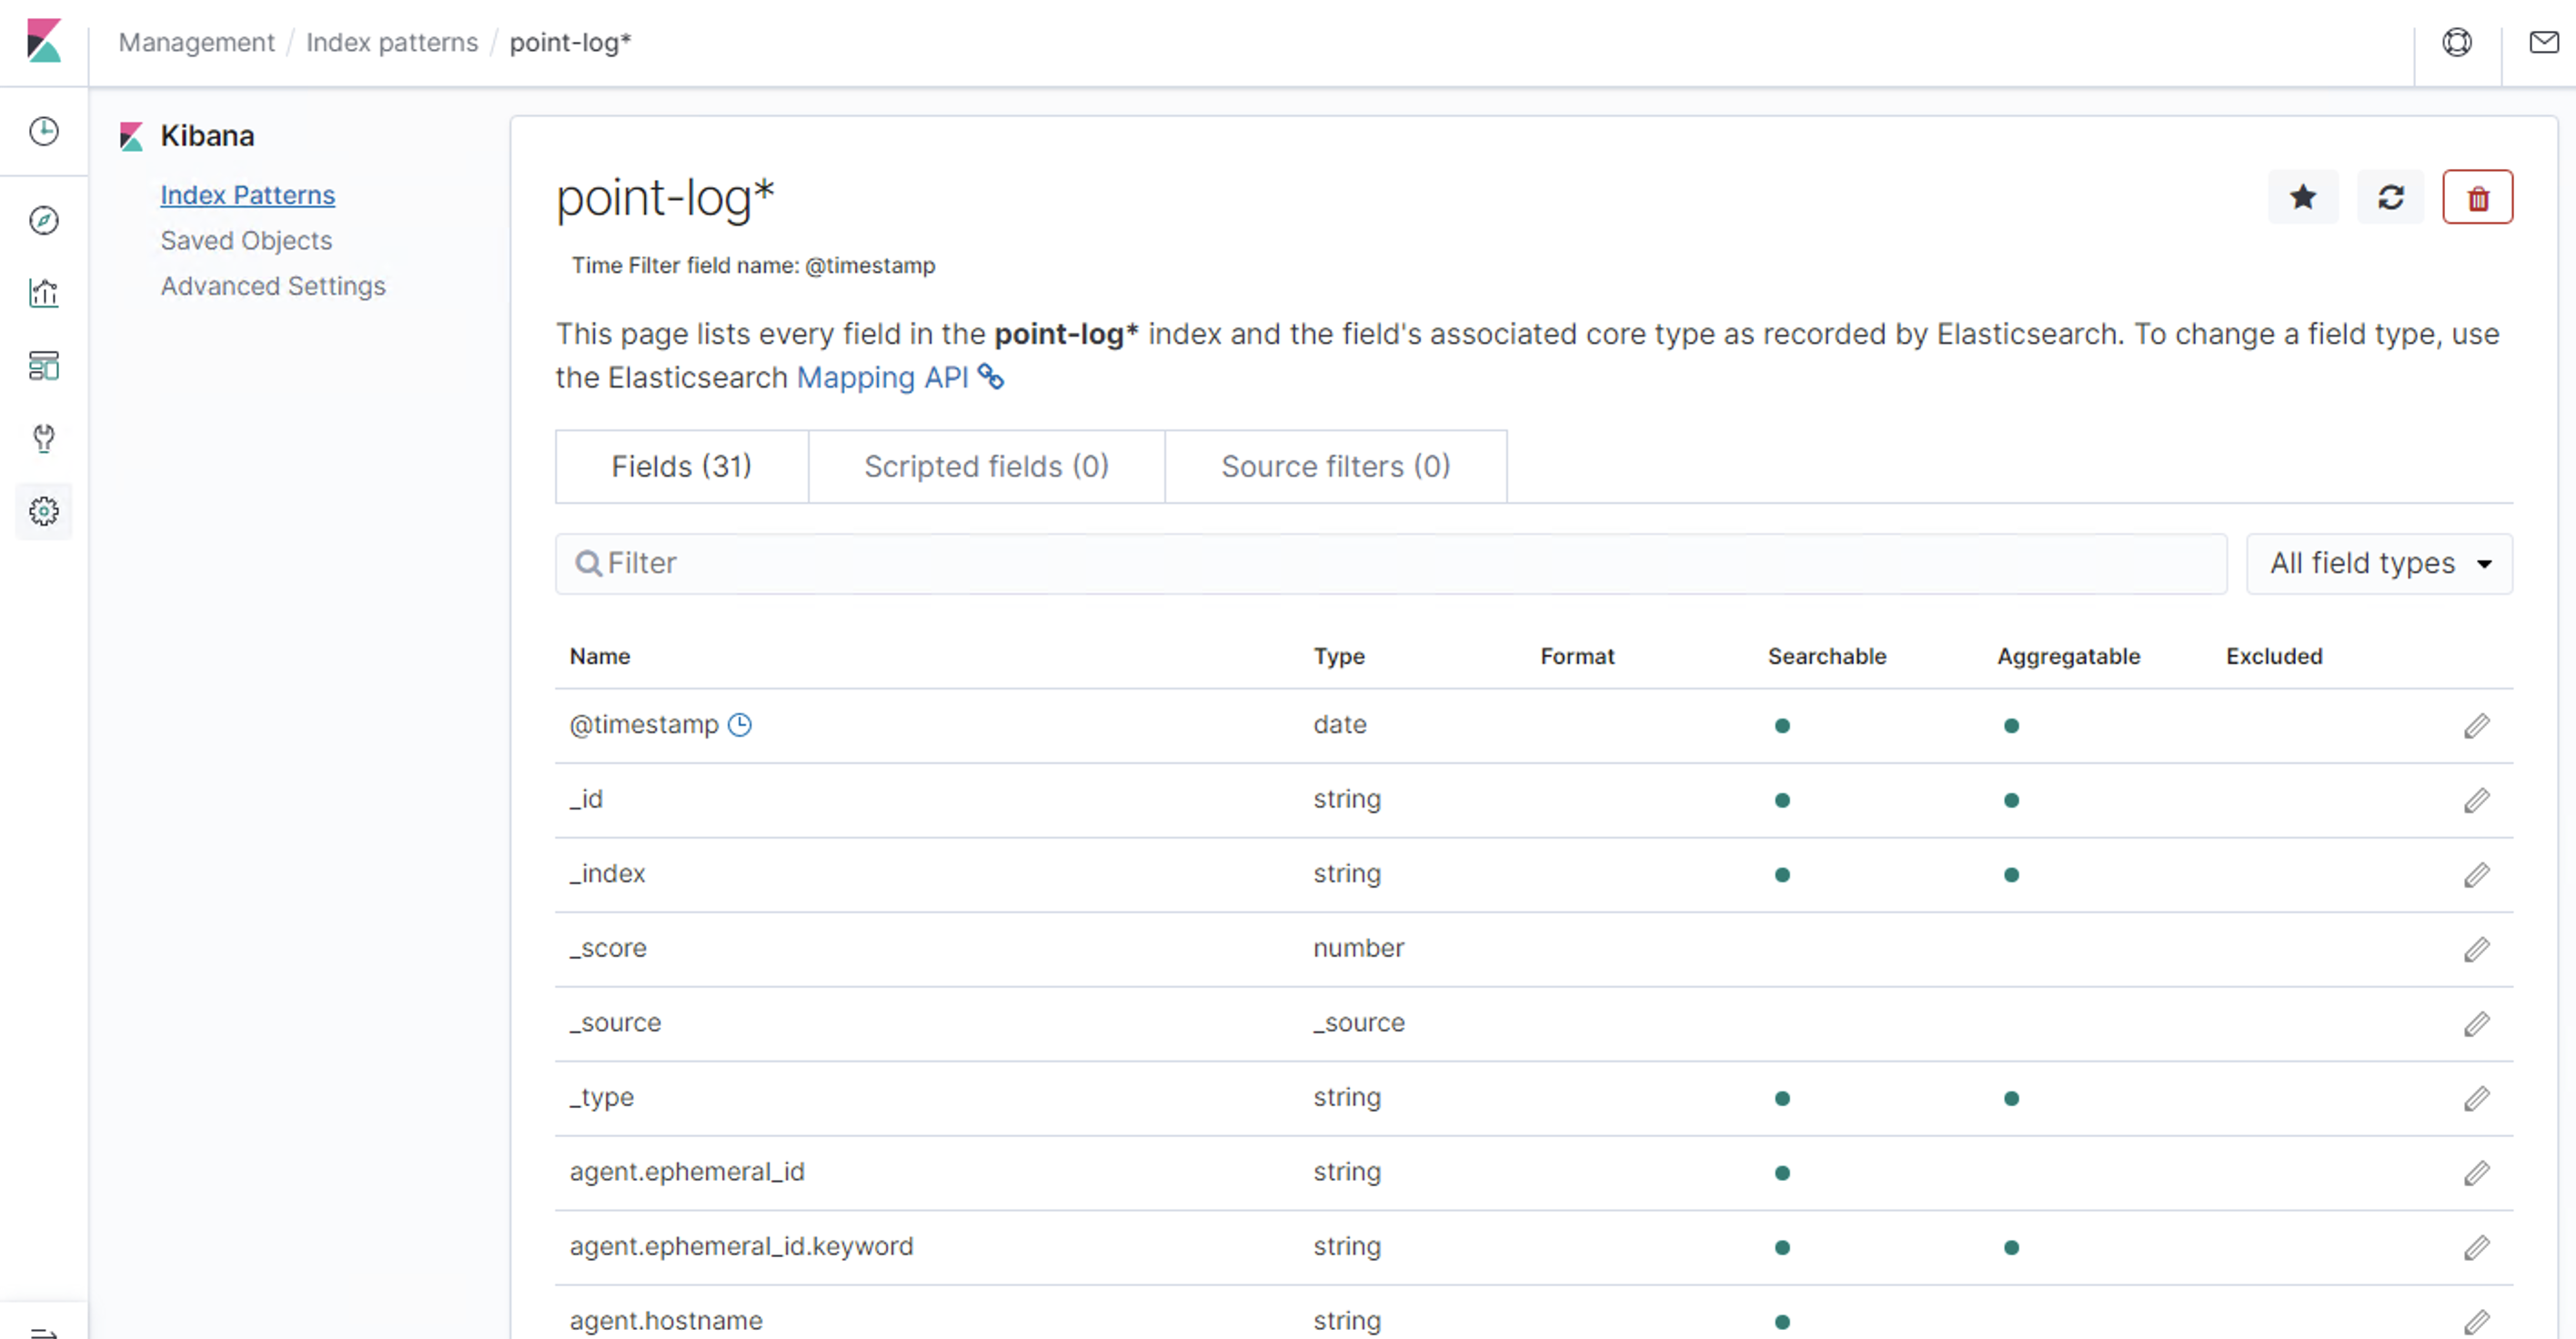
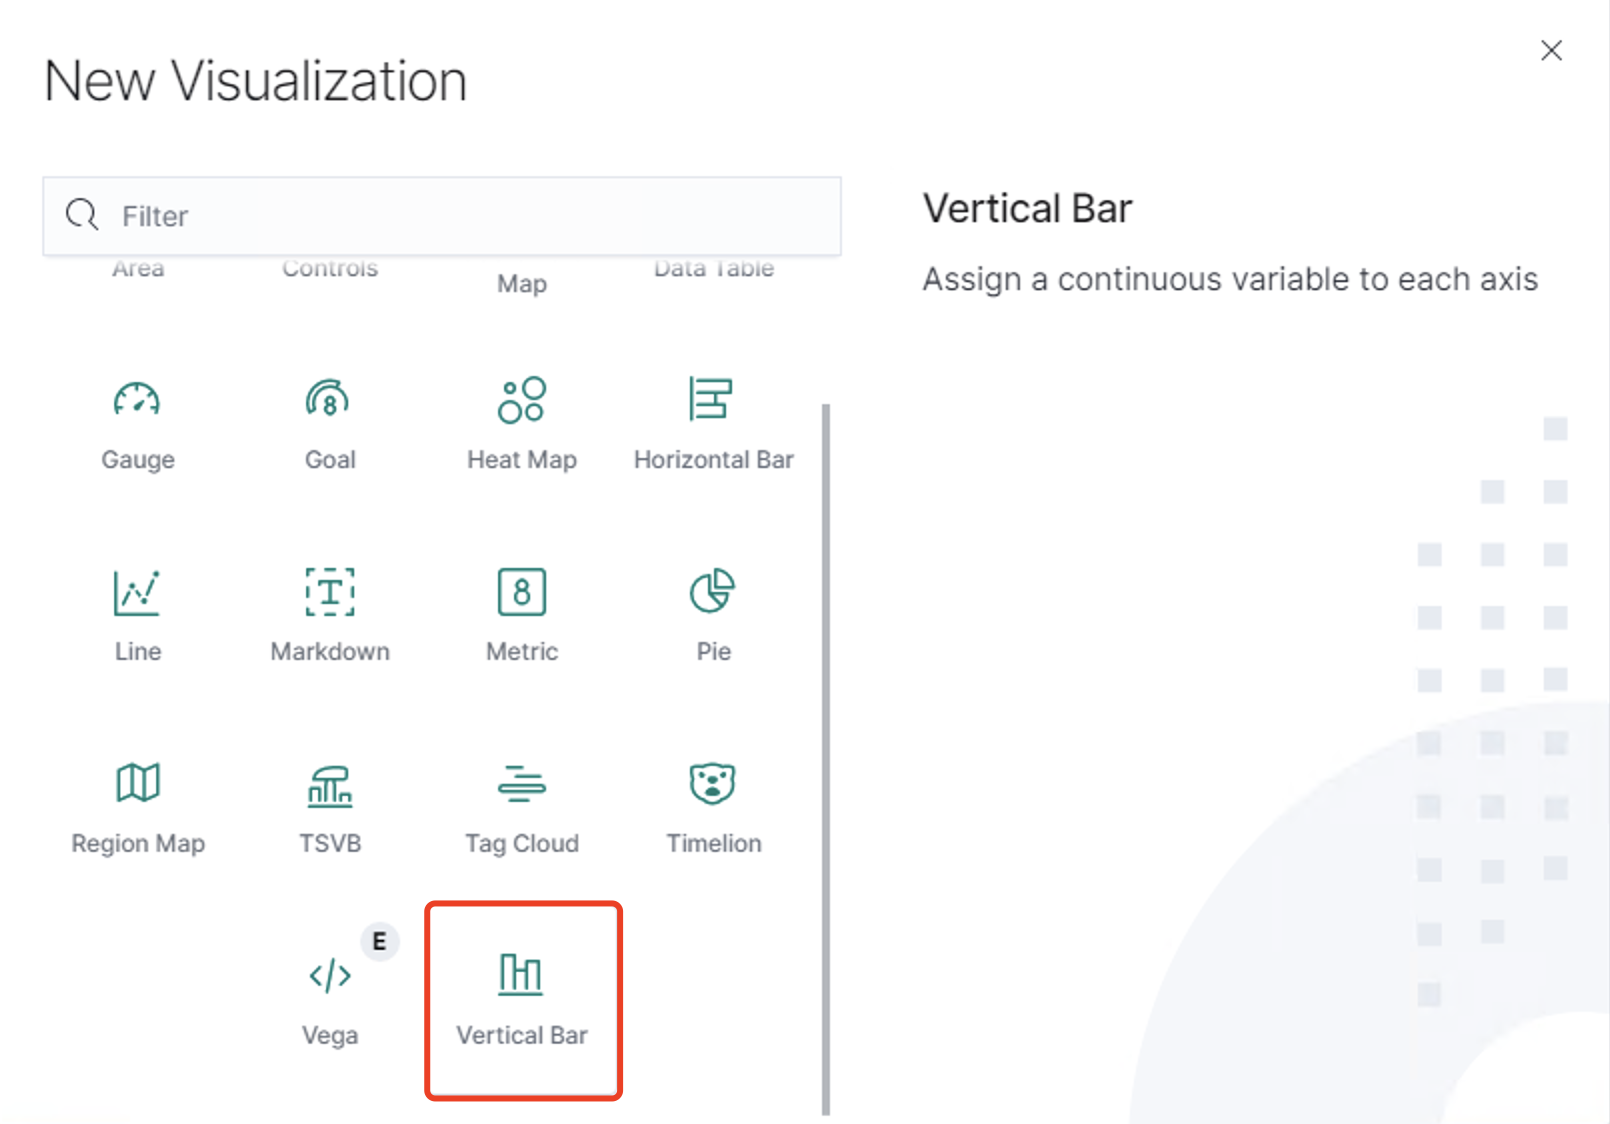
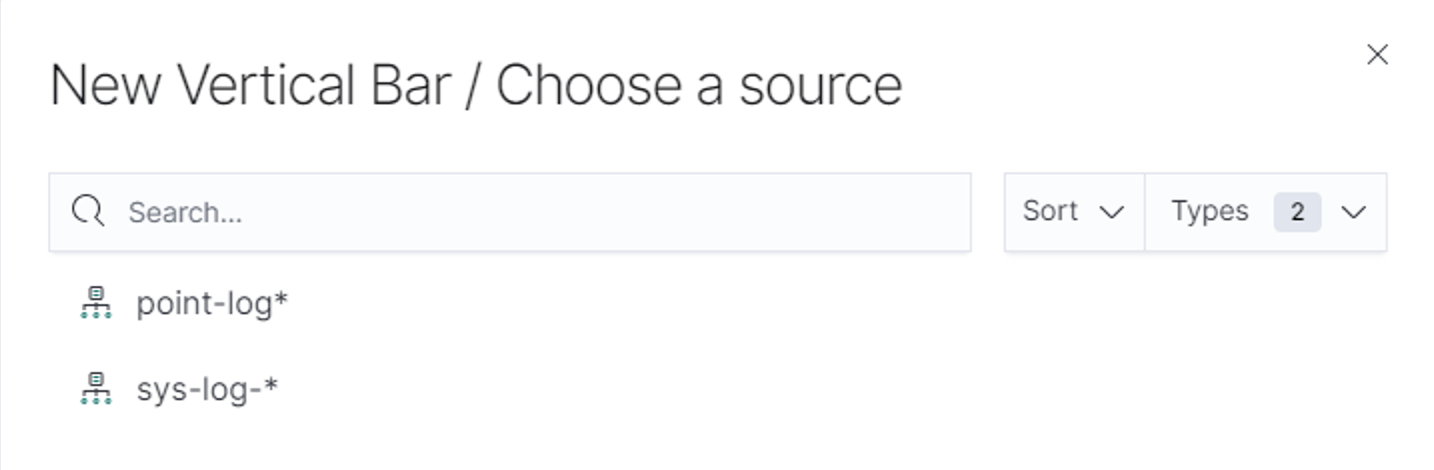
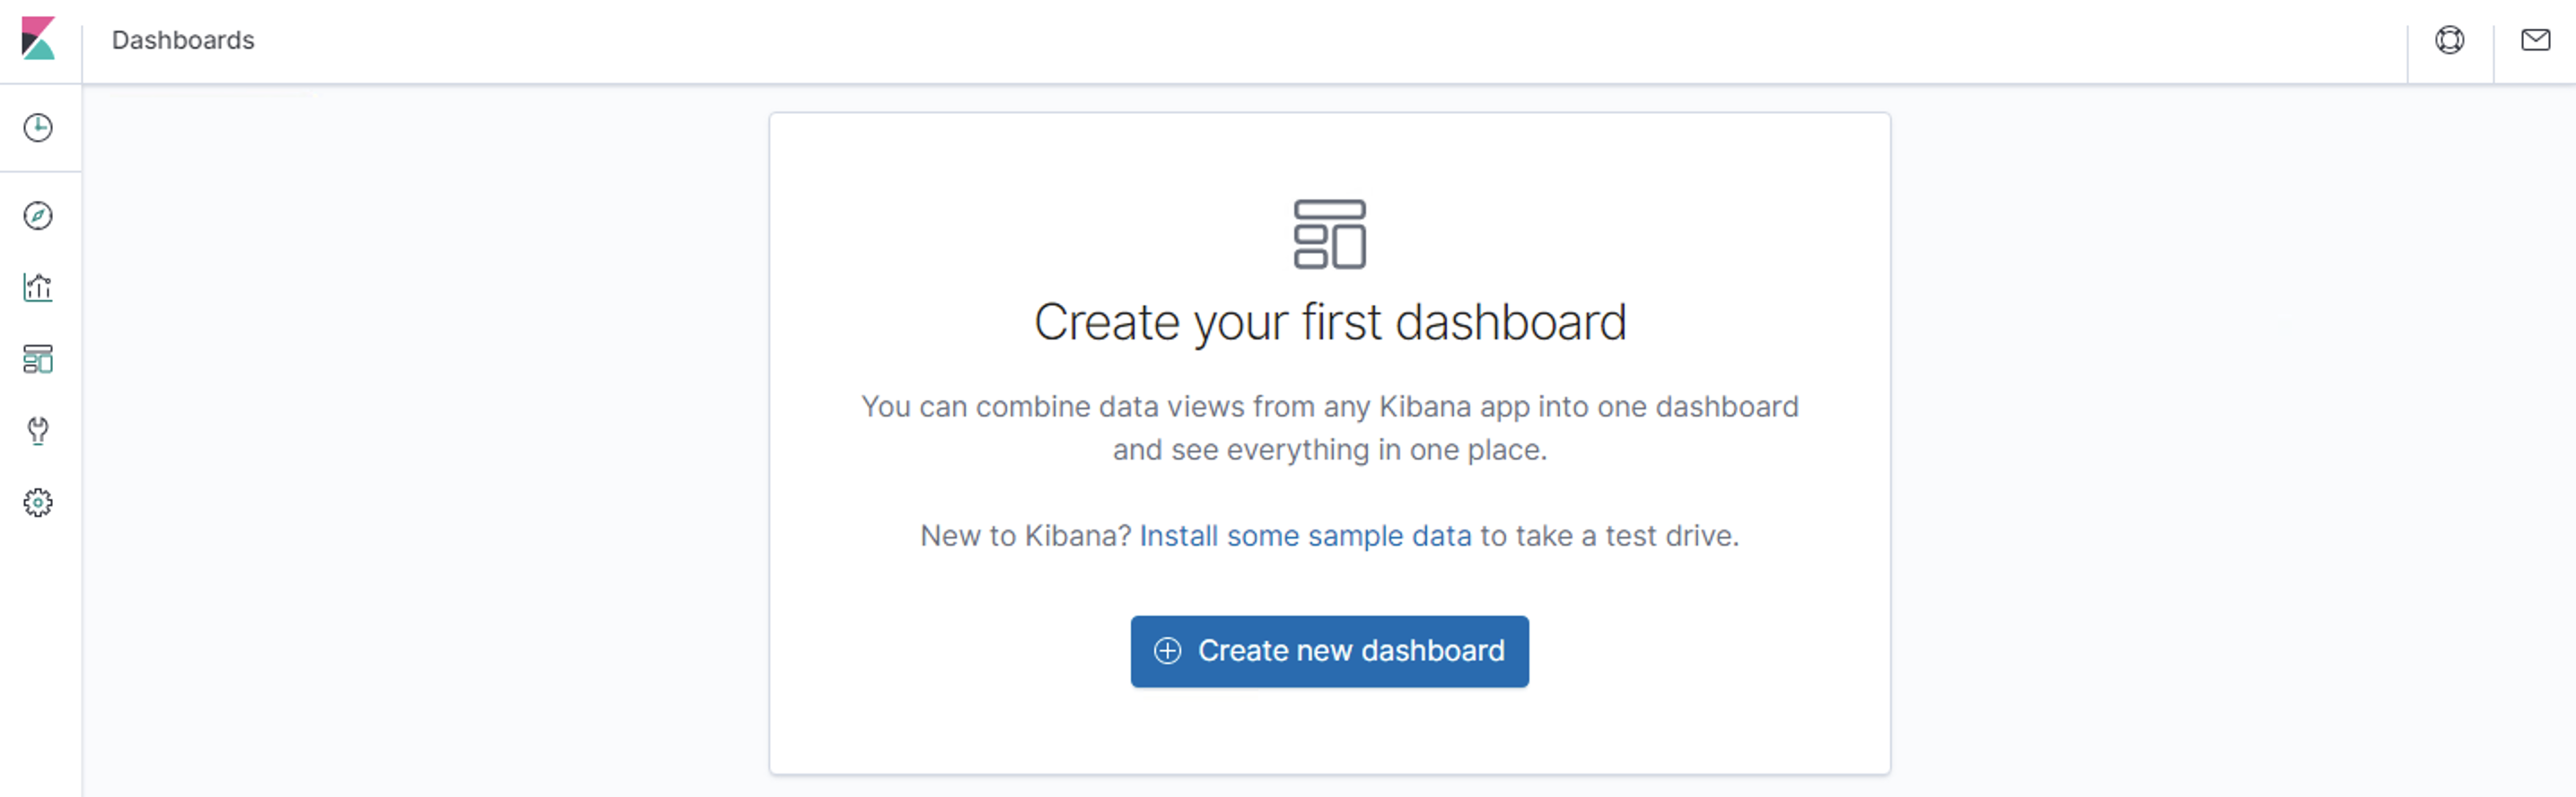
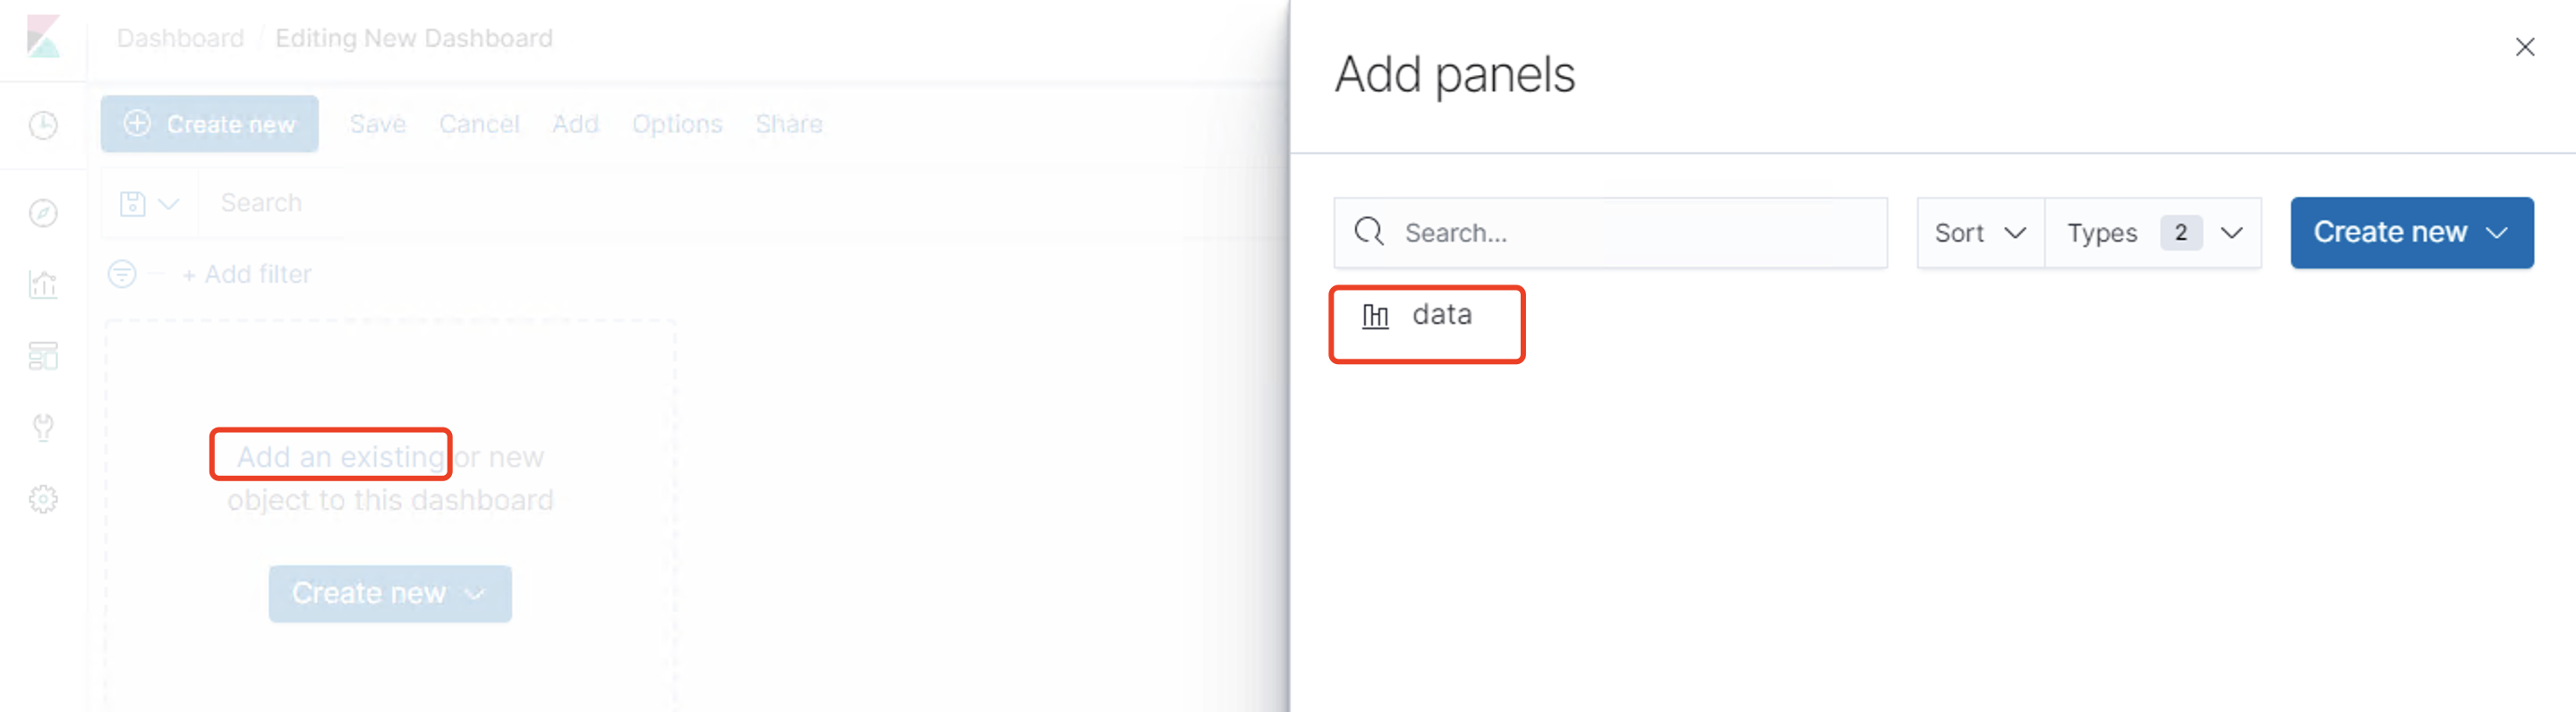
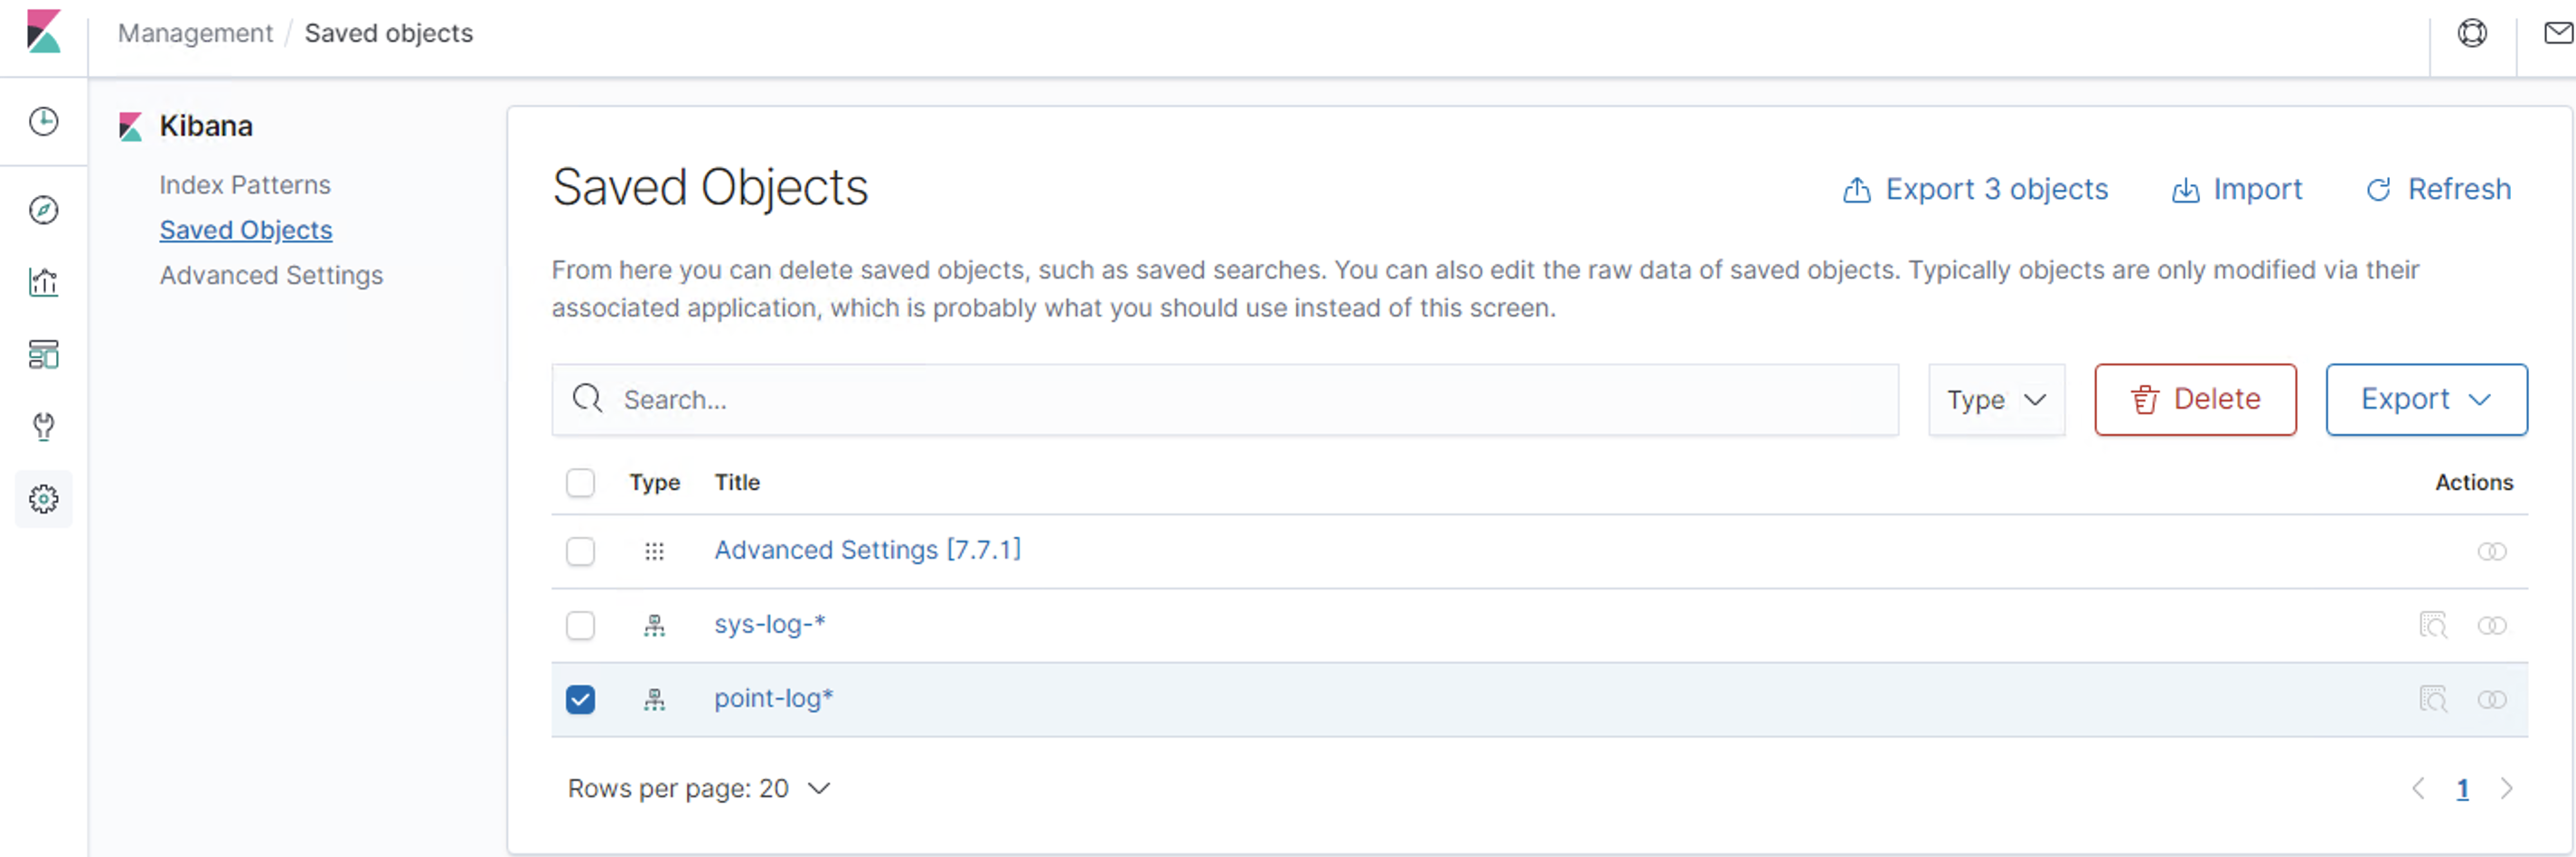
Discover:日志管理视图 主要进行搜索和查询Visualize:统计视图 构建可视化的图表Dashboard:仪表视图 将构建的图表组合形成图表盘Dev Tools: 开发者命令视图 开发工具Management:管理视图 管理工具
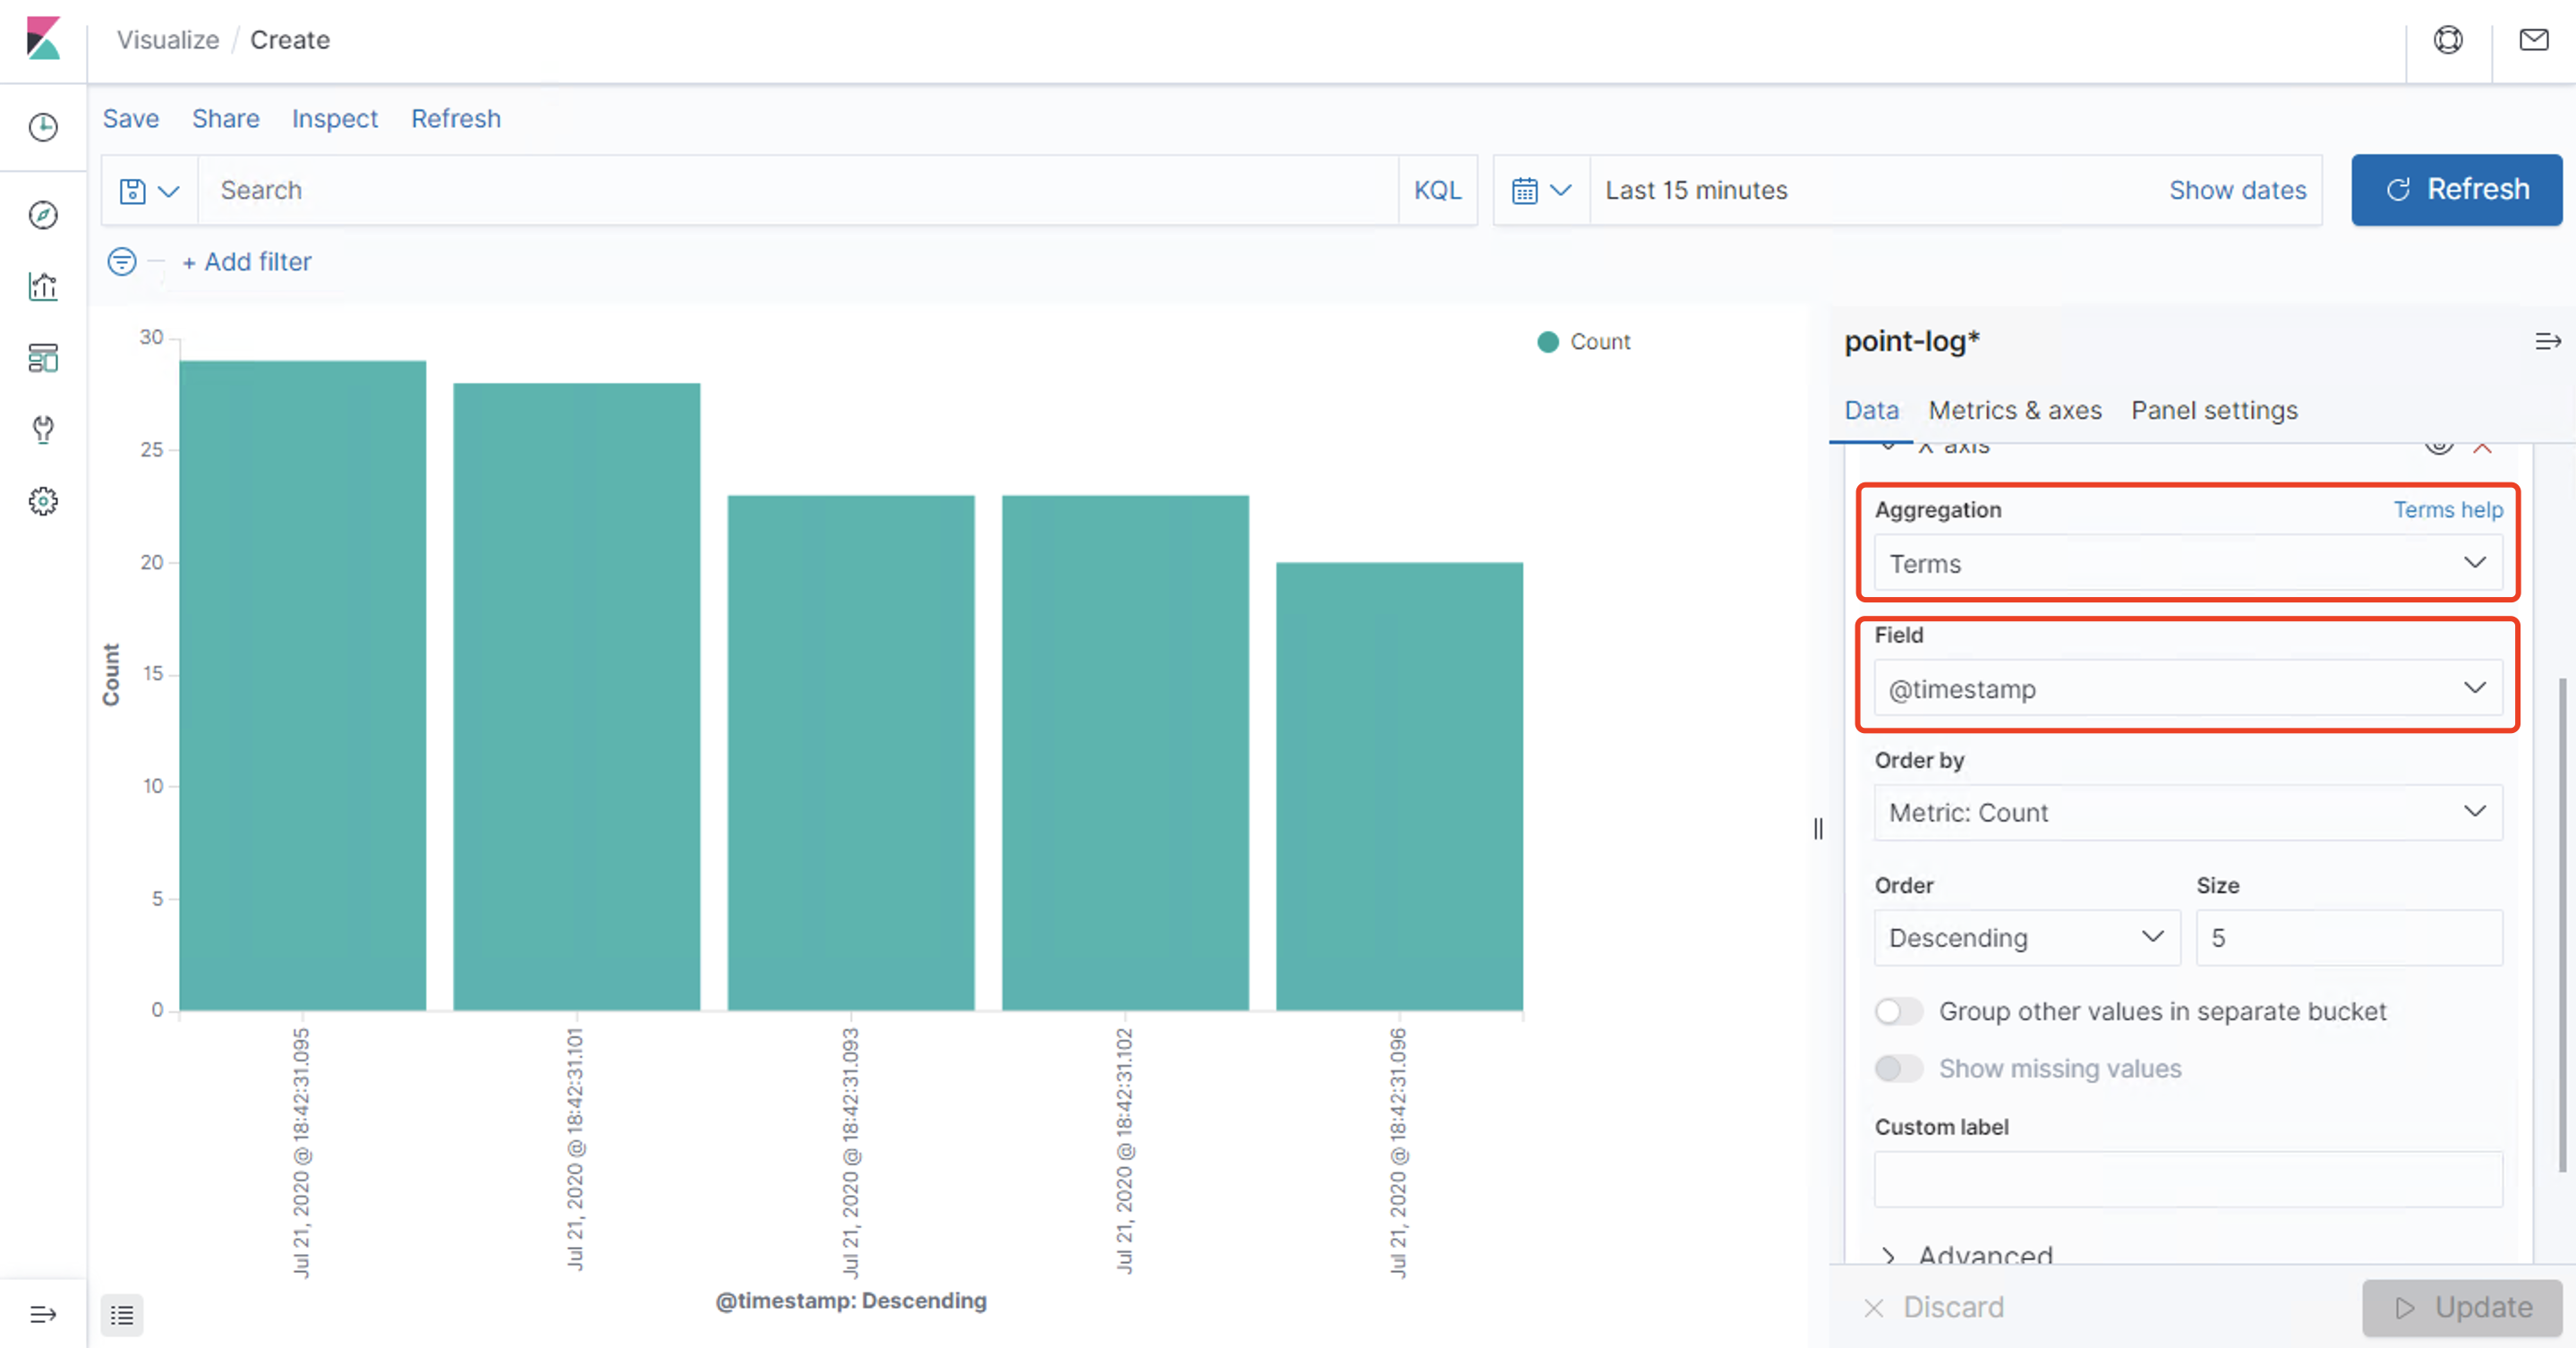
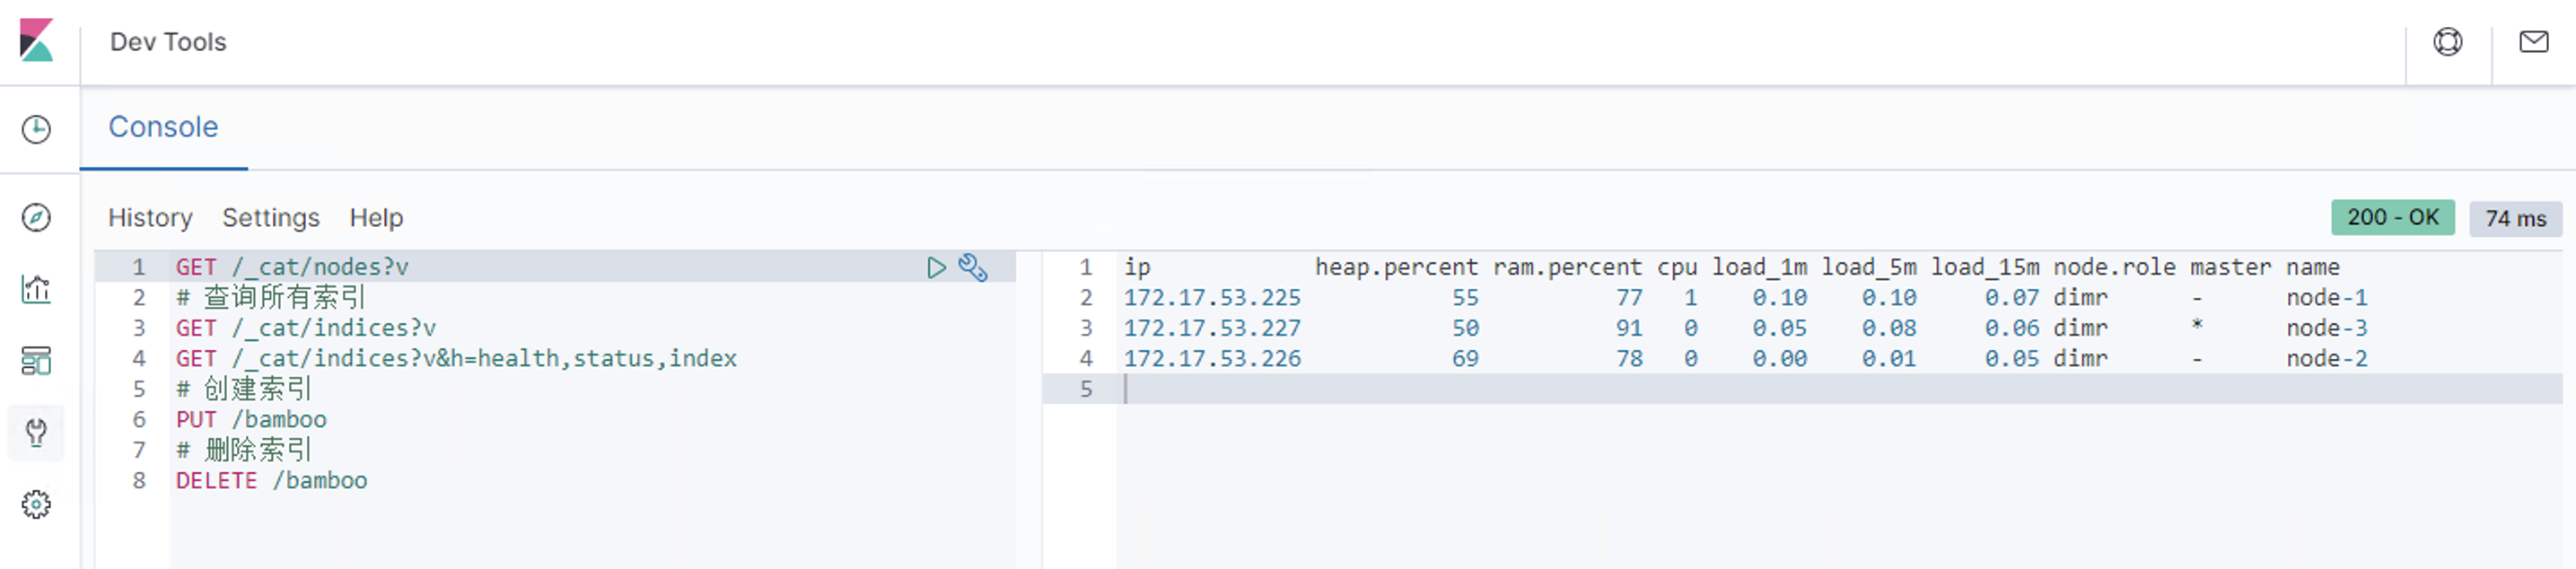
简单查询 自定义索引 @timestamp 字段作为x轴 然后Update仪表盘 展示保存的可视化结果集合Dev Tools 可以看到Console命令行直接可以执行ES的REST风格API,右侧是查询的返回结果Management https://www.cnblogs.com/ygunoil/p/13279514.html https://www.cnblogs.com/chenqionghe/p/12501218.html